Usage Intensity Tool: Maximizing SaaS Efficiency
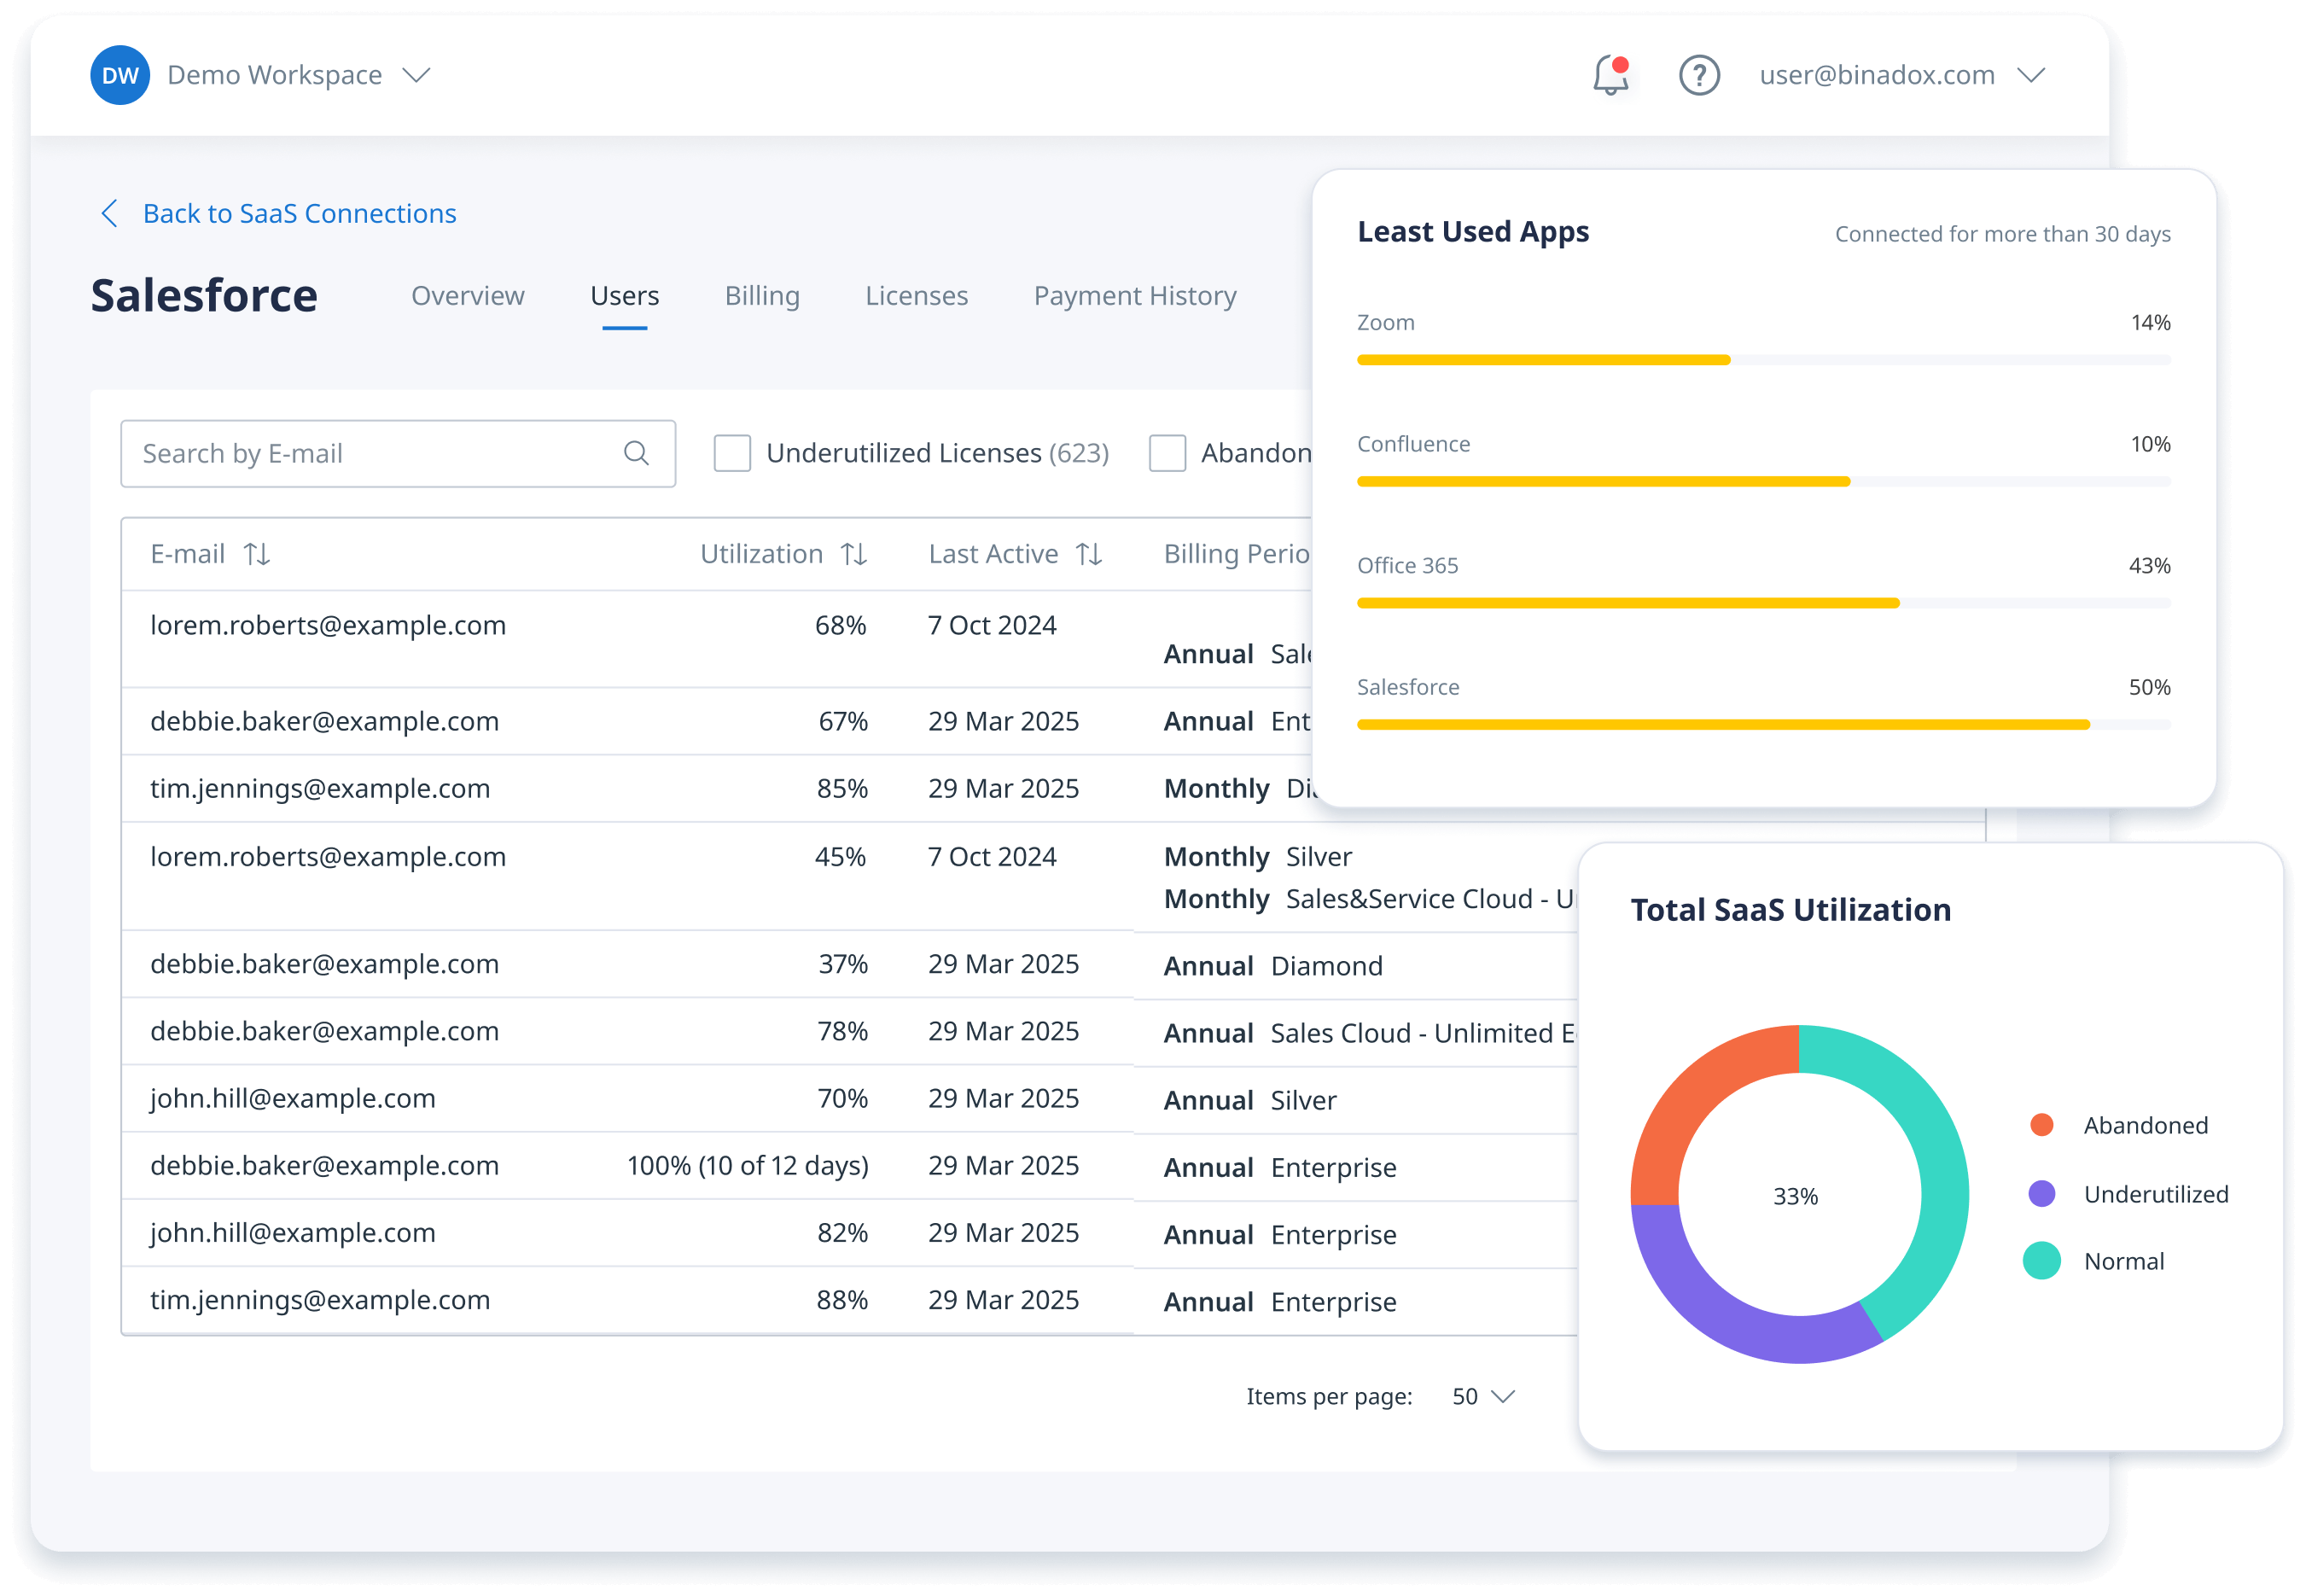
The Usage Intensity tool in Binadox provides a visual representation of the usage patterns for SaaS applications over time, offering detailed insights into user activity trends and resource utilization.
Understanding Usage and Usage Intensity
Usage refers to how actively your team members interact with a SaaS application on any given day. This includes actions like logging in, creating documents, sending messages, running reports, or any other feature utilization within the software.
Usage Intensity measures the concentration and frequency of this usage activity. It represents not just whether an application was used, but how heavily it was utilized compared to other days and other applications. High usage intensity indicates periods of active engagement, while low intensity suggests minimal interaction or underutilization.
How Data is Collected
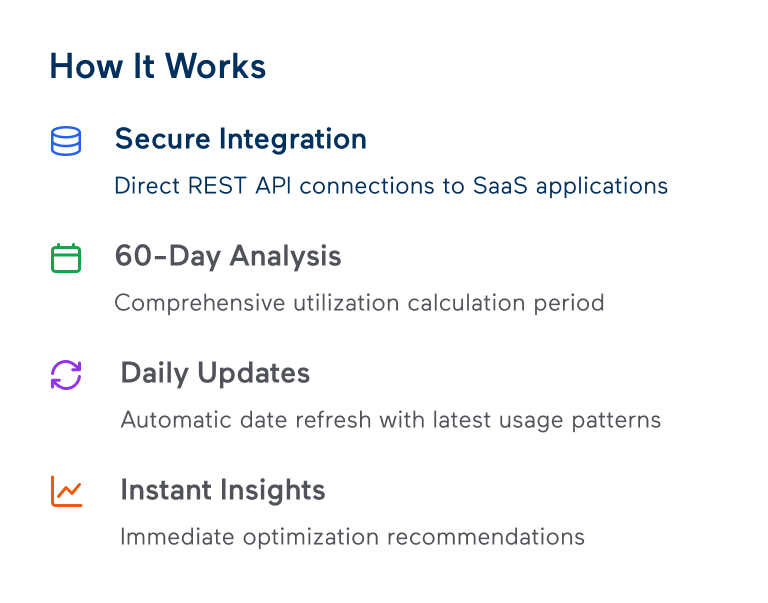
Binadox collects usage data by connecting directly to your SaaS applications through secure integrations. Using REST APIs, the system extracts comprehensive data about users and their application usage patterns. This automated data collection ensures accurate tracking without requiring manual input or disrupting your team’s workflow.
Utilization Calculation: Utilization is calculated for the last 60 days, representing 100% of the available data period. For recently integrated applications, the calculation spans from the moment of integration up to the current day, providing immediate insights even for newly connected services.

Gain Comprehensive Insights
The tool offers a graphical view of the usage intensity for each application. The darker the color on the graph, the higher the usage for that specific day. This gives you an immediate, visual sense of which applications are being used more frequently.
This feature allows for quick identification of underutilized or rarely used applications, which can then be optimized or even eliminated to save costs on unnecessary subscriptions.
Optimize and Save
- Right-sizing Recommendations: By tracking the intensity of usage, the tool helps identify if certain applications are over-provisioned, leading to wasted resources. With this information, you can adjust or scale down subscriptions to better align with actual usage patterns, driving cost savings.
- Cost Anomaly Alerts: If an application’s usage intensity spikes unexpectedly, the tool can help you detect potential cost anomalies. This is key to spotting inefficiencies and optimizing your SaaS spend.
- Automated Actions: With customizable rules, the Usage Intensity tool allows automated actions for specific thresholds of application usage. This helps reduce manual monitoring efforts, making the process of cost optimization seamless.
How It Works
- The graph displays the intensity of use for each connected application, showing a daily pattern of usage. It updates once a day to reflect the most recent data.
- Data Availability: The tool presents data for the current year, and it does not show data for previous years.
- No External Dependencies: There are no additional costs or dependencies on third-party services to use this tool. Once your SaaS system is connected, it’s ready to go.
Get Best SaaS Efficiency with Binadox
By using the Usage Intensity tool, businesses can make informed decisions to reduce unnecessary spending, optimize SaaS subscriptions, and ultimately achieve better cost management. The tool offers visibility into underutilized applications and helps ensure that cloud resources are being used efficiently.