The modern enterprise operates on an average of 80 SaaS applications, with software subscriptions representing one of the fastest-growing expense categories for businesses worldwide. While SaaS solutions provide unparalleled flexibility and scalability, they also create complex cost management challenges that traditional financial tools struggle to address effectively.
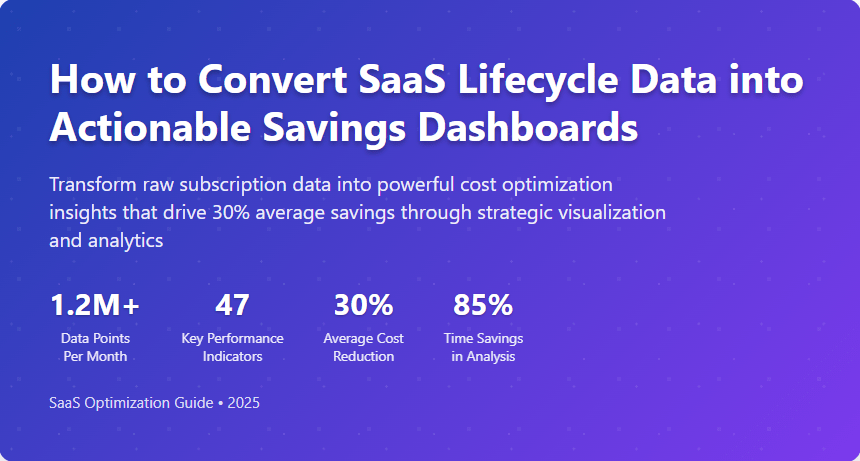
Converting SaaS lifecycle data into actionable savings dashboards has become a critical capability for organizations seeking to optimize their software investments. These specialized dashboards transform raw subscription data, usage metrics, and financial information into clear visual insights that enable data-driven cost optimization decisions.
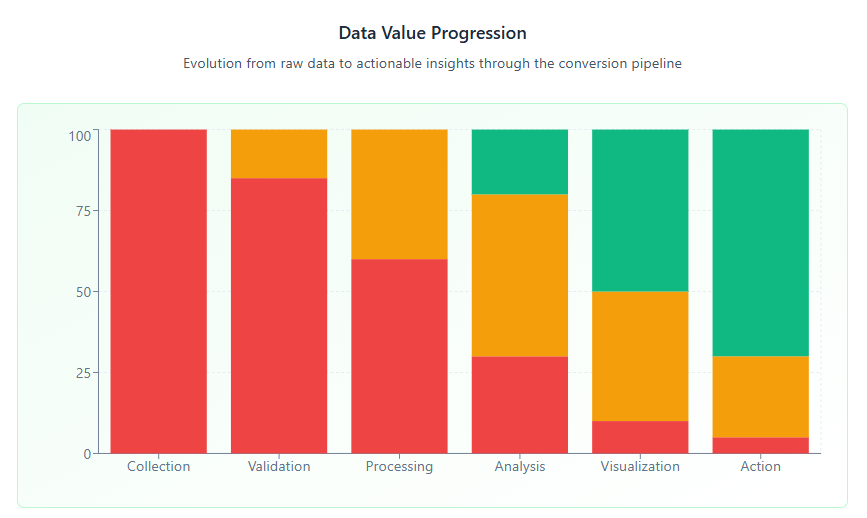
The challenge lies not just in collecting the data, but in organizing it into meaningful visualizations that highlight cost-saving opportunities, identify underutilized resources, and provide predictive insights for future spending optimization. This comprehensive guide explores the methodologies, tools, and best practices for creating effective SaaS savings dashboards that deliver measurable results.
Understanding SaaS Lifecycle Data Components
Core Data Elements
SaaS lifecycle data encompasses multiple dimensions of information that collectively provide a complete picture of your software ecosystem’s financial and operational performance. The primary data components include:
Subscription Information: This foundational layer includes contract details, pricing tiers, billing cycles, renewal dates, and license counts. Understanding these basics is essential for SaaS spend management and forms the backbone of any effective dashboard.
Usage Analytics: Real-time and historical usage data reveals how actively your organization leverages each SaaS application. This includes user login frequencies, feature utilization rates, data consumption patterns, and activity trends over time. Usage analytics are crucial for identifying SaaS optimization opportunities.
Financial Metrics: Cost per user, cost per department, monthly recurring revenue impact, and total cost of ownership calculations provide the economic foundation for optimization decisions. These metrics enable cost transparency across the organization.
User Management Data: Information about user access levels, department assignments, role-based permissions, and individual usage patterns helps identify opportunities for license optimization and access management improvements.
Data Collection Methodologies
API Integration: Most modern SaaS platforms provide robust APIs that enable automated data collection. Integrating with these APIs ensures real-time data accuracy and reduces manual data entry errors. Popular SaaS management tools leverage API connections to maintain current information across all connected applications.
Invoice Processing: Automated invoice processing systems can extract critical financial data from vendor billing statements, including cost changes, new charges, and upcoming renewals. This approach is particularly valuable for applications that don’t provide comprehensive API access.
Usage Monitoring: Implementing monitoring tools that track application usage across your organization provides valuable insights into actual software utilization versus purchased licenses. This data is essential for rightsizing subscriptions and identifying unused licenses.
Dashboard Architecture and Design Principles
Hierarchical Information Structure
Effective SaaS savings dashboards employ a hierarchical approach to information presentation, starting with high-level summaries and allowing users to drill down into specific details. The architecture typically includes:
Executive Summary Level: High-level KPIs including total SaaS spending, month-over-month cost changes, identified savings opportunities, and renewal pipeline summary. This level provides quick insights for executive decision-making and budget planning.
Department/Team Level: Cost allocation by business unit, departmental usage patterns, and team-specific optimization recommendations. This intermediate level enables showback and chargeback methodologies.
Application Level: Detailed analysis of individual SaaS applications, including utilization rates, cost per user, feature usage analytics, and specific optimization recommendations for each tool.
User Level: Individual user access and usage patterns, helping identify inactive users, redundant access permissions, and opportunities for license consolidation.
Visual Design Best Practices
Color Coding Systems: Implementing consistent color schemes that indicate cost efficiency levels, usage intensity, and optimization urgency helps users quickly identify areas requiring attention. Green typically indicates efficient usage, yellow suggests monitoring needs, and red highlights immediate optimization opportunities.
Interactive Elements: Modern dashboards should include interactive filters, drill-down capabilities, and customizable views that allow different stakeholders to focus on relevant information. This interactivity is crucial for making dashboards actionable rather than merely informational.
Mobile Responsiveness: With remote work becoming standard, ensuring dashboard accessibility across devices is essential. Mobile-responsive design enables managers to monitor SaaS spending and usage patterns regardless of location.
Key Metrics and KPIs for SaaS Savings Dashboards
Financial Performance Indicators
Cost Per User Metrics: Calculating the actual cost per active user for each SaaS application reveals opportunities for license optimization and helps justify software investments. This metric should account for both direct subscription costs and indirect costs such as training and support.
Utilization Rates: The percentage of purchased licenses actively used provides immediate insight into potential savings opportunities. Applications with utilization rates below 70% typically present good candidates for license reduction.
Renewal Cost Projections: Forecasting upcoming renewal costs with projected usage adjustments helps organizations budget effectively and negotiate better terms with vendors. This forward-looking metric is essential for cloud financial management.
Savings Opportunity Tracking: Quantifying potential savings from identified optimization opportunities provides clear ROI justification for dashboard implementation and ongoing management efforts.
Operational Efficiency Metrics
Time to Value: Measuring how quickly new users become productive with SaaS applications helps justify software investments and identify training needs that could improve utilization rates.
Feature Adoption Rates: Understanding which features are actively used versus those included in higher-tier subscriptions can inform downgrade decisions and vendor negotiations.
Compliance Metrics: Tracking license compliance, security policy adherence, and regulatory requirement fulfillment ensures that cost optimization efforts don’t compromise organizational standards.
Implementation Strategies
Phase 1: Data Foundation
The first phase of dashboard implementation focuses on establishing reliable data collection and validation processes. This includes:
Inventory Creation: Conducting a comprehensive audit of all SaaS applications used across the organization, including shadow IT discoveries. Many organizations find they have 40-60% more SaaS applications than initially realized.
Data Integration: Establishing connections with major SaaS providers and financial systems to ensure automated data collection. Priority should be given to high-cost applications and those with significant user bases.
Quality Assurance: Implementing data validation rules and regular audits to ensure dashboard accuracy. Inaccurate data undermines user confidence and decision-making effectiveness.
Phase 2: Dashboard Development
Prototype Creation: Developing initial dashboard prototypes with core stakeholders ensures that the final product meets actual business needs rather than theoretical requirements.
User Feedback Integration: Conducting regular feedback sessions with dashboard users helps refine visualizations and add missing functionality. This iterative approach typically results in higher adoption rates.
Training Program Implementation: Providing comprehensive training on dashboard usage and interpretation ensures that organizations can fully leverage their investment in SaaS savings dashboards.
Phase 3: Optimization and Automation
Automated Alerting: Implementing automated alerts for cost anomalies, upcoming renewals, and identified savings opportunities ensures that optimization opportunities aren’t missed due to information overload.
Predictive Analytics: Advanced dashboards incorporate machine learning algorithms that predict future usage patterns and cost trends, enabling proactive rather than reactive management.
Integration with Procurement Systems: Connecting dashboards with procurement workflows streamlines the process of implementing identified optimizations and tracking their results.
Advanced Analytics and Predictive Insights
Machine Learning Applications
Modern SaaS savings dashboards increasingly incorporate machine learning capabilities that enhance their predictive power and automation potential. These advanced features include:
Usage Pattern Recognition: ML algorithms can identify subtle patterns in application usage that human analysts might miss, such as seasonal variations, department-specific usage cycles, and predictive indicators of user abandonment.
Anomaly Detection: Implementing cost anomaly detection helps organizations identify unusual spending patterns that might indicate billing errors, unauthorized usage, or security breaches.
Optimization Recommendations: Advanced systems can automatically generate specific optimization recommendations based on usage patterns, cost thresholds, and organizational policies, moving beyond simple reporting to active management support.
Benchmark Analysis
Industry Comparisons: Comparing your organization’s SaaS spending patterns and utilization rates against industry benchmarks provides context for optimization decisions and helps identify areas where your organization significantly deviates from best practices.
Peer Group Analysis: For organizations within specific industries or size categories, peer group comparisons can reveal optimization opportunities and validate current spending levels.
Historical Trending: Long-term trend analysis helps identify whether optimization efforts are producing sustained results and highlights areas where continued attention is needed.
Integration with Cloud Cost Management
Unified Financial Visibility
Modern organizations typically use both SaaS applications and cloud infrastructure services, making integrated financial visibility crucial for comprehensive cost management. Effective dashboards should provide:
Combined Spending Views: Presenting both SaaS and cloud costs in unified dashboards enables better understanding of total technology spending and identifies optimization opportunities that span both categories.
Cross-Platform Analytics: Understanding how SaaS usage drives cloud infrastructure costs (and vice versa) provides insights into total cost of ownership that individual platform analyses might miss.
Resource Optimization Alignment: Coordinating cloud cost optimization efforts with SaaS management ensures that efficiency improvements in one area don’t create inefficiencies in another.
Multi-Cloud Considerations
Organizations using multiple cloud providers face additional complexity in creating comprehensive savings dashboards. Key considerations include:
Provider-Specific Metrics: Different cloud providers use varying pricing models and reporting structures, requiring normalization for effective comparison and analysis.
Cross-Platform Resource Tracking: Understanding how resources and applications span multiple cloud environments is essential for accurate cost allocation and optimization.
Vendor Management Coordination: Coordinating optimization efforts across multiple vendors requires sophisticated project management capabilities within dashboard systems.
Measuring Success and ROI
Performance Metrics
Successful SaaS savings dashboard implementations should demonstrate measurable improvements in cost management effectiveness:
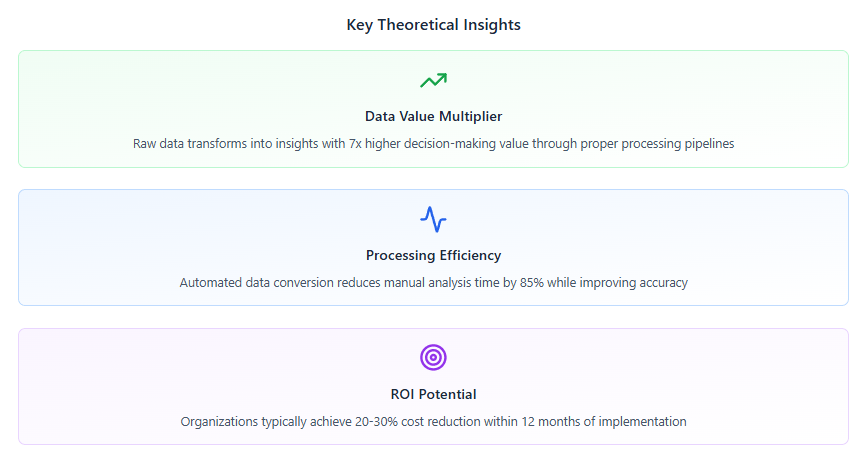
Cost Reduction Achievement: Most organizations achieve 20-30% reductions in SaaS spending within the first year of implementing comprehensive savings dashboards, with continued improvements over time.
Time Savings: Automating manual processes for expense tracking, license management, and renewal monitoring typically saves finance and IT teams 15-25 hours per month.
Decision Speed: Organizations with effective dashboards make optimization decisions 3-5 times faster than those relying on manual analysis, enabling more responsive cost management.
Continuous Improvement Processes
Regular Review Cycles: Establishing monthly or quarterly review processes ensures that dashboards remain relevant and continue providing value as organizational needs evolve.
Feature Enhancement: Continuously adding new capabilities based on user feedback and changing business requirements prevents dashboard obsolescence and maintains user engagement.
Best Practice Sharing: Organizations that share successful dashboard strategies across teams and departments typically achieve better overall results than those that implement solutions in isolation.
Common Implementation Challenges and Solutions
Data Quality Issues
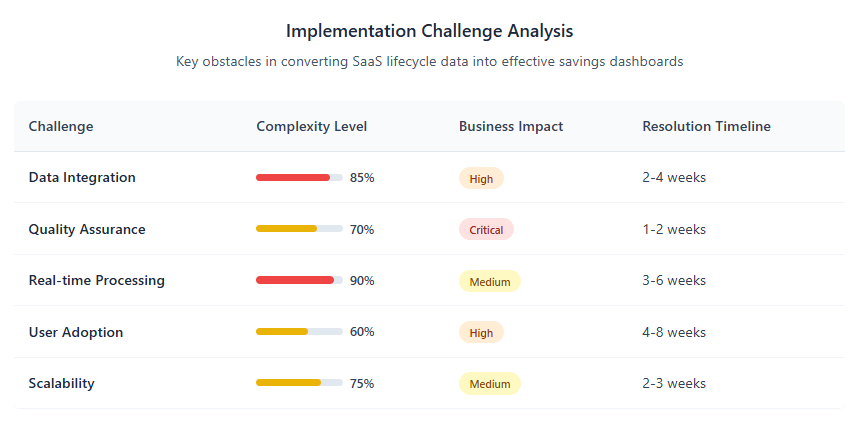
Inconsistent Data Sources: Different SaaS providers often use varying data formats and reporting standards, creating integration challenges. Successful implementations include robust data normalization processes that ensure consistency across sources.
Missing Information: Some applications provide limited API access or reporting capabilities, requiring creative solutions such as invoice processing, manual data entry, or third-party integration tools.
Real-Time vs. Batch Processing: Balancing the need for current information with system performance requirements often requires hybrid approaches that prioritize real-time updates for critical metrics while using batch processing for comprehensive analytics.
User Adoption Challenges
Training Requirements: Dashboard effectiveness depends heavily on user competency, requiring comprehensive training programs and ongoing support resources.
Change Management: Shifting from manual processes to dashboard-driven decision-making requires cultural changes that extend beyond technical implementation.
Stakeholder Alignment: Different organizational roles require different dashboard views and capabilities, necessitating flexible designs that serve multiple audiences effectively.
Future Trends and Emerging Technologies
Artificial Intelligence Integration
The next generation of SaaS savings dashboards will increasingly incorporate AI capabilities that go beyond current machine learning applications:
Natural Language Processing: AI-powered interfaces that allow users to ask questions in natural language and receive specific answers about SaaS spending and optimization opportunities.
Automated Optimization: Systems that can automatically implement approved optimization strategies, such as license adjustments and subscription changes, based on predetermined criteria and approval workflows.
Predictive Modeling: Advanced forecasting capabilities that predict not just usage and costs, but also business impact of optimization decisions, helping organizations balance cost savings with operational effectiveness.
Integration Ecosystem Evolution
Platform Consolidation: The trend toward comprehensive technology business management platforms that integrate SaaS management with broader IT financial management capabilities.
Vendor Ecosystem Development: Increasing cooperation between SaaS providers and management platforms to improve data sharing and optimization capabilities.
Industry-Specific Solutions: Development of specialized dashboard solutions for particular industries with unique compliance, reporting, or operational requirements.
Conclusion
Converting SaaS lifecycle data into actionable savings dashboards represents a crucial capability for modern organizations seeking to optimize their software investments while maintaining operational effectiveness. The process requires careful attention to data quality, thoughtful dashboard design, and comprehensive change management to ensure successful adoption and sustained benefits.
Organizations that implement effective SaaS savings dashboards typically achieve significant cost reductions, improved operational efficiency, and better strategic alignment between technology investments and business objectives. The key to success lies in taking a systematic approach that prioritizes data quality, user experience, and continuous improvement over time.
As the SaaS ecosystem continues to evolve and mature, the importance of sophisticated management and optimization tools will only increase. Organizations that invest in comprehensive dashboard capabilities today will be better positioned to manage the complexity and costs of tomorrow’s software landscape.
The investment in SaaS savings dashboards pays dividends not just in direct cost savings, but in improved decision-making capabilities, enhanced operational transparency, and better strategic alignment between technology spending and business outcomes. For organizations serious about optimizing their software investments, actionable savings dashboards have become an essential component of modern IT financial management.
By following the strategies and best practices outlined in this guide, organizations can transform their SaaS lifecycle data from a source of complexity into a competitive advantage that drives both cost efficiency and operational excellence in the digital economy.