In today’s competitive digital landscape, Software as a Service (SaaS) applications have become the backbone of modern business operations. As organizations increasingly rely on SaaS solutions for critical business functions, the importance of maintaining optimal performance standards cannot be overstated. SaaS performance benchmarking serves as a crucial practice that enables businesses to measure, compare, and optimize their cloud-based applications against industry standards and competitive benchmarks.
The rapid adoption of SaaS platforms across industries has created an environment where performance excellence directly translates to business success. Users today expect lightning-fast response times, near-perfect uptime, and seamless experiences that rival traditional on-premises software solutions. This shift in expectations has made SaaS performance benchmarking not just a technical consideration, but a strategic business imperative.
Understanding and implementing effective SaaS performance benchmarking strategies allows organizations to ensure their applications meet user expectations, maintain competitive advantages, and deliver consistent value to customers. Through systematic measurement and analysis of key performance indicators, businesses can identify optimization opportunities, prevent performance degradation, and make data-driven decisions about their SaaS infrastructure investments.
This comprehensive guide explores the essential aspects of SaaS performance benchmarking, providing insights into industry standards, measurement methodologies, and optimization strategies that drive superior user experiences and business outcomes in the cloud computing era.
What is SaaS Performance Benchmarking?
SaaS performance benchmarking is the systematic process of measuring, analyzing, and comparing the performance characteristics of Software as a Service applications against established industry standards, competitor benchmarks, and internal performance targets. This practice encompasses multiple dimensions of application performance, including response times, availability metrics, scalability parameters, and user satisfaction indicators.
At its core, SaaS performance benchmarking involves collecting quantitative data about how applications perform under various conditions and comparing these metrics against predefined benchmarks or industry standards. This process enables organizations to understand their current performance position, identify areas for improvement, and track progress over time.
The benchmarking process typically involves establishing baseline performance metrics, conducting regular performance assessments, analyzing comparative data against industry standards, and implementing optimization strategies based on findings. Unlike traditional software performance testing, SaaS performance benchmarking must account for the distributed nature of cloud infrastructure, varying network conditions, and the multi-tenant architecture that characterizes most SaaS solutions.
Modern SaaS performance benchmarking extends beyond basic technical metrics to include user experience indicators, business impact measurements, and cost-effectiveness analysis. This holistic approach ensures that performance optimization efforts align with business objectives and deliver measurable value to both end users and organizations.
Effective benchmarking programs incorporate continuous monitoring capabilities, automated alerting systems, and comprehensive reporting mechanisms that provide stakeholders with actionable insights into application performance trends and optimization opportunities.
Why SaaS Performance Benchmarking Matters
The significance of SaaS performance benchmarking in today’s business environment cannot be understated. As organizations become increasingly dependent on cloud-based applications, performance issues can directly impact productivity, revenue generation, and customer satisfaction levels.
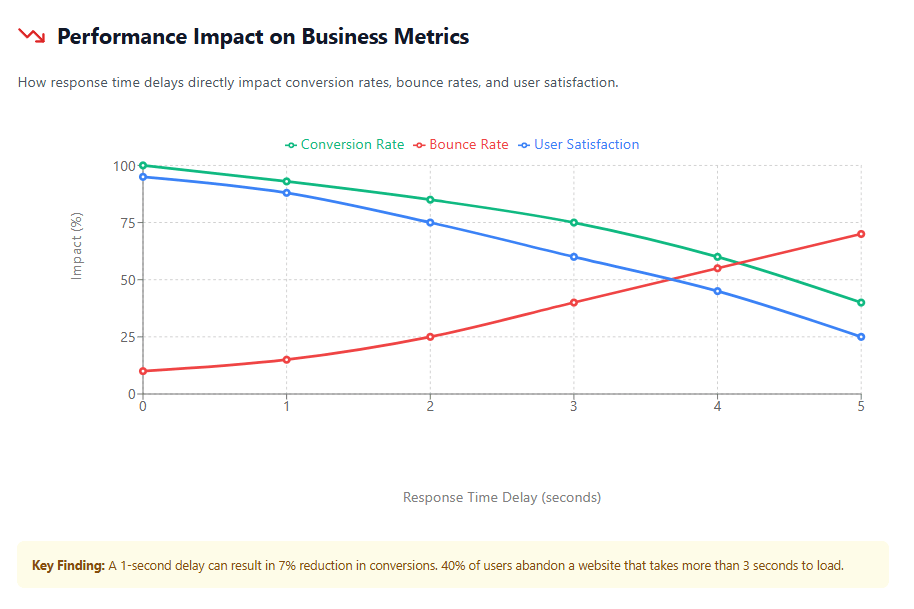
Research indicates that even minor performance degradations can have substantial business consequences. Studies show that a one-second delay in page load time can result in a 7% reduction in conversions, while 40% of users abandon a website that takes more than three seconds to load. For SaaS applications that serve as critical business tools, these performance impacts are magnified across entire organizations.
From a competitive perspective, SaaS performance benchmarking enables organizations to maintain market positioning by ensuring their applications meet or exceed user expectations set by leading industry solutions. In markets where functionality differences between competing products are minimal, superior performance often becomes the key differentiator that influences purchasing decisions and user retention rates.
Cost optimization represents another crucial benefit of systematic performance benchmarking. By identifying performance bottlenecks, resource utilization inefficiencies, and scaling opportunities, organizations can optimize their cloud cost optimization strategies while maintaining service quality levels.
The practice also supports proactive issue resolution by establishing performance baselines that enable early detection of anomalies or degradation trends. This predictive capability allows IT teams to address potential problems before they impact user experiences or business operations.
Furthermore, SaaS performance benchmarking provides the data foundation necessary for making informed decisions about infrastructure investments, scaling strategies, and technology selections. Organizations with comprehensive benchmarking programs are better positioned to optimize their SaaS stack cost-effectiveness while ensuring performance requirements are consistently met.
Key Performance Indicators for SaaS Applications
Successful SaaS performance benchmarking relies on measuring and analyzing the right set of key performance indicators (KPIs) that provide comprehensive insights into application performance across multiple dimensions. These metrics serve as the foundation for understanding current performance levels, identifying optimization opportunities, and tracking improvement progress over time.
Response Time Metrics form the cornerstone of SaaS performance measurement. Average response time represents the typical time required for the application to process and respond to user requests, while 95th percentile response time captures performance under higher load conditions. Peak response time measurements help identify worst-case scenarios and potential performance bottlenecks that could impact user experiences during high-demand periods.
Throughput and Concurrency Indicators measure the application’s capacity to handle multiple simultaneous users and requests. Transactions per second (TPS) quantifies the application’s processing capacity, while concurrent user limits define the maximum number of simultaneous users the system can support without performance degradation. These metrics are particularly crucial for understanding scalability characteristics and planning capacity requirements.
Availability and Reliability Metrics track the consistency of service delivery over time. Uptime percentage measures the proportion of time the application remains accessible and functional, while Mean Time Between Failures (MTBF) indicates system reliability. Mean Time to Recovery (MTTR) measures how quickly issues are resolved when they occur, providing insights into operational efficiency and incident response capabilities.
Resource Utilization Indicators provide visibility into how effectively the underlying infrastructure supports application performance. CPU utilization percentages, memory consumption patterns, and network bandwidth usage help identify resource constraints that could impact performance. Database performance metrics, including query response times and connection pool utilization, offer insights into backend system efficiency.
User Experience Metrics capture the human impact of application performance. Page load times, user session durations, and task completion rates provide direct indicators of how performance affects user productivity and satisfaction. Error rates and timeout occurrences highlight potential user frustration points that could impact adoption and retention.
Business Impact Measurements connect technical performance to business outcomes. Customer satisfaction scores, support ticket volumes related to performance issues, and user retention rates provide context for the business significance of performance optimization efforts.
Industry Standards for SaaS Performance
The SaaS industry has established widely accepted performance standards that serve as benchmarks for measuring application quality and user experience. These standards provide organizations with objective targets for performance optimization efforts and enable competitive comparisons across similar solutions.
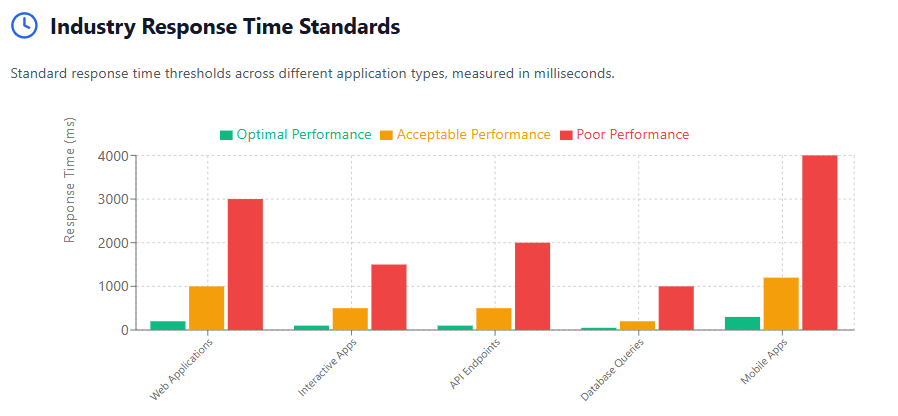
Response Time Standards vary by application type and use case, but industry consensus generally establishes that web-based SaaS applications should achieve average response times under 200 milliseconds for optimal user experience. Interactive applications requiring real-time user feedback should target response times below 100 milliseconds, while batch processing operations may accept longer response times depending on the complexity of operations involved.
The 95th percentile response time standard typically allows for response times up to 1 second, ensuring that the vast majority of user interactions remain responsive even during peak usage periods. Applications exceeding these response time thresholds risk user frustration and potential abandonment, particularly in competitive markets where users have alternative solution options.
Availability Standards in the SaaS industry commonly target 99.9% uptime as a minimum acceptable level, translating to approximately 8.76 hours of downtime per year. Higher-tier SaaS solutions often promise 99.95% or 99.99% availability, reflecting the critical nature of the applications and the premium pricing associated with enhanced service levels.
Enterprise-grade SaaS applications frequently commit to 99.99% availability standards, allowing for only 52.56 minutes of downtime annually. Mission-critical applications in industries such as financial services or healthcare may require even higher availability standards, often reaching 99.999% uptime guarantees.
Scalability Benchmarks define expectations for how applications should perform as usage scales. Industry standards typically require that applications maintain consistent response times as concurrent user loads increase up to specified limits. Performance degradation should be minimal and predictable, with clear capacity thresholds communicated to users.
Load testing standards generally expect SaaS applications to handle sudden traffic spikes of 200-300% above normal usage levels without service disruption. Auto-scaling capabilities should activate within predetermined thresholds to maintain performance standards during demand fluctuations.
Error Rate Standards establish acceptable levels of application failures and errors. Industry benchmarks typically target error rates below 0.1% for critical operations and under 1% for non-critical functions. These standards ensure that the vast majority of user interactions complete successfully, maintaining confidence in application reliability.
Speed Benchmarking: Response Time and Load Performance
Speed benchmarking represents one of the most critical aspects of SaaS performance evaluation, as response times directly impact user productivity and satisfaction. Effective speed benchmarking requires comprehensive measurement across various performance scenarios and user interaction patterns.
Page Load Speed Measurements establish baselines for initial application loading performance. Industry research indicates that optimal page load times should remain under 3 seconds, with exceptional performance achieving load times under 1 second. These measurements should account for different network conditions, device types, and geographic locations to provide realistic performance expectations.
Modern SaaS applications increasingly implement progressive loading techniques that prioritize critical functionality while secondary features load in the background. Speed benchmarking must therefore measure both initial functional availability and complete page load completion to provide comprehensive performance insights.
API Response Time Benchmarking focuses on the backend processing efficiency that drives application functionality. REST API endpoints should typically respond within 100-500 milliseconds depending on operation complexity, while GraphQL queries may require different performance thresholds based on data complexity and processing requirements.
Database query performance significantly impacts API response times, making it essential to benchmark individual query execution times alongside overall API performance. Complex analytical queries may require longer processing times, but these should be clearly differentiated from standard operational queries in benchmarking protocols.
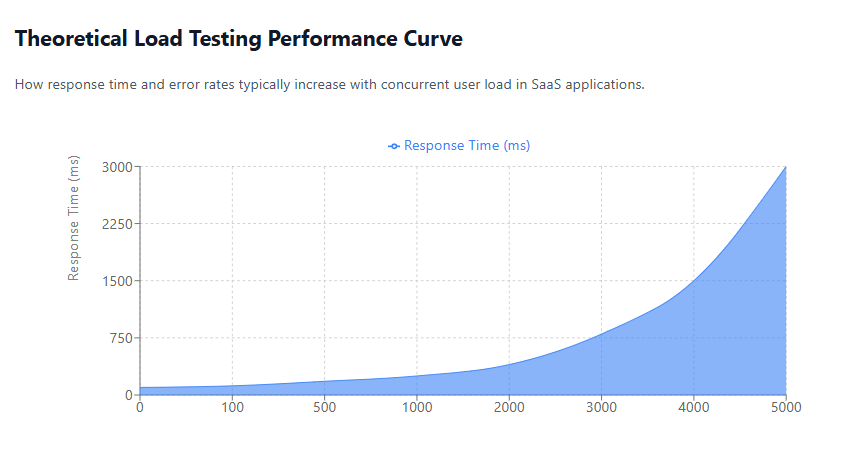
Load Performance Testing evaluates how applications perform under varying user loads and traffic patterns. Baseline load testing establishes performance characteristics under normal usage conditions, while stress testing identifies breaking points and performance degradation patterns under extreme conditions.
Gradual load increase testing helps identify the specific user concurrency levels where performance begins to degrade, enabling proactive scaling decisions. Peak load testing simulates worst-case scenarios to ensure applications can maintain acceptable performance during high-demand periods.
Geographic Performance Variations must be considered in speed benchmarking for SaaS applications serving global user bases. Content delivery network (CDN) performance, regional server proximity, and network infrastructure quality can significantly impact response times for users in different geographic locations.
Comprehensive speed benchmarking includes measurements from multiple global locations to ensure consistent performance delivery regardless of user location. This geographic benchmarking helps identify regions requiring additional infrastructure investments or optimization efforts.
Uptime Monitoring and Availability Standards
Uptime monitoring and availability standards form the foundation of reliable SaaS service delivery, directly impacting user trust and business continuity. Effective uptime monitoring requires sophisticated systems that can detect and respond to availability issues before they significantly impact user experiences.
Service Level Agreement (SLA) Commitments typically define minimum uptime standards that SaaS providers guarantee to customers. Industry-standard SLAs commonly offer 99.9% uptime guarantees, though premium services may commit to 99.95% or higher availability levels. These commitments often include financial penalties or service credits when availability falls below guaranteed levels.
Enterprise customers frequently negotiate higher availability standards due to the critical nature of their operations. Mission-critical applications may require 99.99% or 99.999% availability commitments, necessitating redundant infrastructure, automated failover systems, and comprehensive disaster recovery capabilities.
Monitoring System Architecture must provide comprehensive visibility into all components that could impact service availability. Synthetic monitoring systems continuously test application functionality from multiple geographic locations, simulating real user interactions to detect issues before users encounter them.
Real user monitoring (RUM) complements synthetic monitoring by capturing actual user experience data, providing insights into how availability issues impact different user segments and geographic regions. This dual monitoring approach ensures comprehensive coverage of potential availability problems.
Incident Response Protocols define how quickly availability issues are detected, escalated, and resolved. Industry best practices typically require issue detection within 1-2 minutes of occurrence, with initial response actions beginning within 5 minutes. Full resolution timeframes vary based on issue complexity but generally target restoration within 4 hours for major incidents.
Automated incident response systems can significantly reduce Mean Time to Recovery (MTTR) by implementing predetermined response actions for common availability issues. These systems can automatically restart failed services, redirect traffic to healthy infrastructure, or scale resources to address capacity-related availability problems.
Planned Maintenance Windows require careful scheduling to minimize impact on user availability. Industry standards typically limit planned maintenance to specific time windows with advance notice requirements ranging from 24 hours for minor maintenance to several weeks for major system updates.
Maintenance window scheduling should consider global user distribution patterns to minimize the number of users affected during maintenance periods. Rolling deployment strategies and blue-green deployment techniques can often reduce or eliminate downtime during planned maintenance activities.
Availability Reporting and Transparency builds user confidence by providing clear visibility into service performance. Monthly availability reports should include uptime percentages, incident summaries, and improvement actions taken to prevent future issues. Public status pages enable real-time visibility into service health and ongoing incident resolution efforts.
User Satisfaction Metrics and Measurement
User satisfaction metrics provide crucial insights into how technical performance translates to real-world user experiences and business outcomes. These measurements go beyond technical benchmarks to capture the human impact of application performance on productivity, efficiency, and overall user sentiment.
Net Promoter Score (NPS) serves as a comprehensive indicator of user satisfaction and loyalty. This metric measures the likelihood that users would recommend the SaaS application to colleagues or peers, providing insights into overall satisfaction levels and competitive positioning. Industry benchmarks for SaaS applications typically target NPS scores above 30, with exceptional products achieving scores above 50.
NPS measurements should be collected regularly and segmented by user demographics, feature usage patterns, and performance experience levels to identify specific satisfaction drivers and improvement opportunities. Correlation analysis between NPS scores and technical performance metrics helps prioritize optimization efforts based on user impact.
Customer Satisfaction (CSAT) Scores provide more granular insights into specific aspects of user experience. These surveys typically focus on particular features, support interactions, or performance characteristics, enabling targeted improvement efforts. CSAT scores above 4.0 (on a 5-point scale) generally indicate satisfactory user experiences, while scores above 4.5 represent exceptional satisfaction levels.
Performance-related CSAT questions should address specific user experience elements such as application speed, reliability, and ease of use. Regular CSAT collection enables trend analysis and rapid identification of performance issues impacting user satisfaction.
Task Completion Rates measure how effectively users can accomplish their intended objectives within the application. High task completion rates indicate that performance levels support productive user workflows, while declining completion rates may signal performance issues impacting user productivity.
Task completion analysis should consider both successful completion rates and time-to-completion metrics. Users may successfully complete tasks despite performance issues, but increased completion times can indicate underlying performance problems affecting efficiency.
User Retention and Churn Analysis provides long-term indicators of satisfaction and performance impact. High churn rates, particularly when correlated with performance incidents or degradation periods, suggest that performance issues are driving user abandonment. Retention analysis should examine cohorts of users experiencing different performance levels to quantify the relationship between performance and retention.
Support Ticket Analysis offers insights into user frustration levels and performance-related issues. Tickets related to application speed, availability problems, or functionality issues provide direct feedback on performance problems impacting users. Tracking support ticket volumes, resolution times, and user satisfaction with support responses helps identify performance improvement priorities.
Performance-related support tickets should be categorized by issue type, user impact level, and resolution complexity to identify patterns and recurring problems requiring systematic solutions rather than individual incident responses.
Feature Adoption and Usage Patterns reveal how performance impacts user engagement with different application capabilities. Features experiencing performance issues often show declining usage rates, while well-performing features demonstrate higher adoption and engagement levels. Usage analytics should be correlated with performance metrics to identify performance barriers to feature adoption.
Tools and Technologies for Performance Benchmarking
The landscape of SaaS performance benchmarking tools has evolved significantly, offering organizations sophisticated options for measuring, analyzing, and optimizing application performance across multiple dimensions. Selecting the appropriate toolset requires understanding the specific capabilities and limitations of different monitoring and benchmarking technologies.
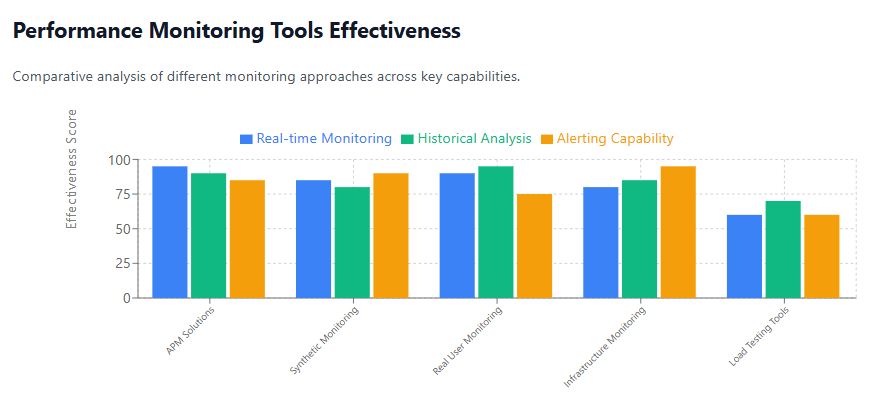
Application Performance Monitoring (APM) Solutions provide comprehensive visibility into application behavior, user experiences, and infrastructure performance. Leading APM tools like New Relic, Datadog, and AppDynamics offer real-time monitoring capabilities, automated alerting systems, and detailed performance analytics that enable proactive optimization efforts.
Modern APM solutions incorporate artificial intelligence and machine learning capabilities that can automatically detect performance anomalies, predict potential issues, and recommend optimization actions. These intelligent monitoring systems reduce the manual effort required for performance management while improving the accuracy of issue detection and resolution.
Synthetic Monitoring Platforms enable consistent performance testing from multiple geographic locations and network conditions. Tools such as Pingdom, GTmetrix, and WebPageTest provide automated testing capabilities that simulate real user interactions and measure performance metrics under controlled conditions.
Synthetic monitoring is particularly valuable for establishing performance baselines, conducting competitive benchmarking, and validating performance improvements after optimization efforts. These platforms often include alerting capabilities that notify teams when performance degrades below specified thresholds.
Real User Monitoring (RUM) Systems capture actual user experience data from production environments, providing insights into how performance variations impact different user segments and usage patterns. RUM data complements synthetic monitoring by revealing performance issues that may not be apparent in controlled testing environments.
Advanced RUM solutions can segment performance data by user demographics, device types, network conditions, and geographic locations to identify specific user groups experiencing performance issues. This segmentation enables targeted optimization efforts that address real-world usage patterns.
Load Testing and Performance Testing Tools enable comprehensive evaluation of application scalability and performance under various load conditions. Solutions like JMeter, LoadRunner, and Artillery provide capabilities for simulating realistic user loads and measuring performance characteristics under stress conditions.
Cloud-based load testing platforms offer the advantage of generating test traffic from multiple geographic locations while scaling to simulate extremely high user loads without requiring significant on-premises infrastructure investments. These platforms often integrate with continuous integration pipelines to enable automated performance testing as part of development workflows.
Infrastructure Monitoring Solutions provide visibility into the underlying systems supporting SaaS applications. Tools like Prometheus, Grafana, and CloudWatch monitor server performance, database efficiency, network utilization, and other infrastructure metrics that impact application performance.
Container and microservices monitoring tools such as Kubernetes monitoring solutions and service mesh observability platforms are increasingly important for modern SaaS applications built on distributed architectures. These tools provide insights into service-to-service communication performance and resource utilization patterns.
Business Intelligence and Analytics Platforms enable correlation of performance metrics with business outcomes and user satisfaction indicators. Tools that can combine technical performance data with user behavior analytics, support ticket information, and business metrics provide comprehensive insights into performance impact on organizational objectives.
Organizations implementing effective cloud management tools often integrate multiple monitoring and benchmarking solutions to create comprehensive performance visibility across their entire SaaS ecosystem.
Best Practices for SaaS Performance Optimization
Implementing effective SaaS performance optimization requires a systematic approach that combines technical improvements with organizational processes and continuous monitoring practices. Organizations that successfully optimize SaaS performance typically follow established best practices that address both immediate performance issues and long-term scalability requirements.
Performance-First Development Culture establishes performance considerations as integral to the development process rather than an afterthought. Development teams should incorporate performance testing into their regular workflows, set performance budgets for new features, and use performance metrics as key criteria in design decisions.
Code review processes should include performance impact assessment, with particular attention to database queries, API calls, and resource-intensive operations. Performance regression testing should be automated as part of continuous integration pipelines to prevent performance degradation from reaching production environments.
Caching Strategy Implementation represents one of the most effective approaches to improving SaaS application performance. Multi-level caching strategies should include browser caching for static assets, application-level caching for frequently accessed data, and database query result caching for computationally expensive operations.
Content Delivery Network (CDN) implementation ensures that static assets and cached content are served from geographically distributed locations, reducing latency for users regardless of their location. CDN configurations should be optimized for the specific content types and user access patterns characteristic of the SaaS application.
Database Performance Optimization often yields significant performance improvements since database operations frequently represent performance bottlenecks in SaaS applications. Query optimization, proper indexing strategies, and database connection pooling can dramatically improve response times and system scalability.
Database performance monitoring should identify slow queries, inefficient joins, and resource-intensive operations that could be optimized or redesigned. Regular database maintenance, including index optimization and query plan analysis, helps maintain consistent performance as data volumes grow.
Infrastructure Scaling Strategies must balance performance requirements with cost effectiveness. Auto-scaling configurations should be tuned to respond quickly to traffic increases while avoiding unnecessary resource provisioning during normal operations. Horizontal scaling often provides better performance characteristics than vertical scaling for SaaS applications serving multiple tenants.
Container orchestration platforms like Kubernetes enable sophisticated scaling strategies that can dynamically allocate resources based on actual application demand patterns. These platforms can automatically scale individual microservices based on their specific resource requirements and performance characteristics.
Performance Monitoring and Alerting Systems enable proactive issue identification and resolution before performance problems impact users. Monitoring systems should track both technical metrics and user experience indicators, with alerting thresholds configured to provide early warning of potential issues.
Alert fatigue can be minimized by implementing intelligent alerting systems that use machine learning to distinguish between normal performance variations and genuine issues requiring attention. Progressive alerting escalation ensures that critical performance issues receive appropriate attention while reducing unnecessary interruptions for minor variations.
Regular Performance Audits and Reviews help maintain performance standards over time and identify optimization opportunities that may not be apparent through continuous monitoring. Quarterly performance reviews should examine trends, benchmark against industry standards, and prioritize improvement initiatives based on user impact and business value.
Performance audit processes should include competitive benchmarking to ensure that application performance remains competitive within the market. Third-party performance audits can provide objective assessments and identify blind spots that internal teams may overlook.
Industry-Specific Performance Requirements
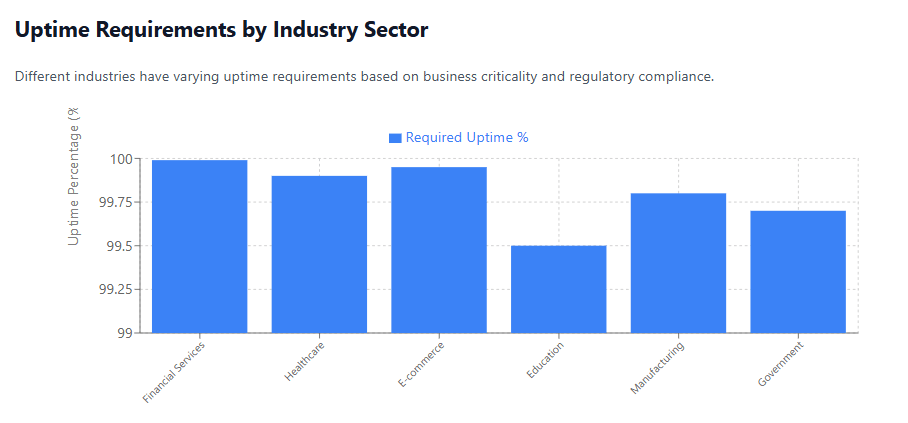
Different industries have unique performance requirements driven by regulatory compliance, user expectations, and business-critical operational needs. Understanding industry-specific performance standards enables SaaS providers to tailor their applications and optimization strategies to meet sector-specific demands effectively.
Financial Services Performance Standards typically require the highest levels of performance and reliability due to regulatory requirements and the time-sensitive nature of financial transactions. Trading applications may require response times under 10 milliseconds, while banking applications generally target response times under 100 milliseconds for critical operations.
Availability requirements in financial services often exceed 99.99%, with some trading systems requiring 99.999% availability during market hours. Disaster recovery capabilities must enable rapid failover with minimal data loss, often requiring real-time data replication across geographically distributed data centers.
Financial services applications must also meet strict security performance requirements, balancing security controls with application responsiveness. Multi-factor authentication, encryption, and compliance monitoring systems must be implemented without significantly impacting user experience or transaction processing speed.
Healthcare Industry Requirements focus heavily on availability and data integrity while maintaining reasonable performance standards. Electronic Health Record (EHR) systems must be available 24/7 to support emergency medical care, typically requiring 99.9% or higher availability standards.
Response time requirements in healthcare vary by application type, with clinical decision support systems requiring rapid response times under 1 second, while administrative systems may accept longer response times. Patient portal applications should target consumer-grade performance standards to encourage patient engagement.
Healthcare applications must implement performance monitoring that complies with HIPAA requirements and other privacy regulations. Performance data collection and analysis must avoid exposing protected health information while still providing actionable insights for optimization efforts.
Manufacturing and Supply Chain Applications require performance standards that support real-time operational decision-making and inventory management. Warehouse management systems often require response times under 500 milliseconds to support efficient picking and packing operations.
Supply chain visibility applications must handle large volumes of tracking data and provide real-time updates on shipment status and inventory levels. Performance standards should account for integration with multiple external systems and data sources that may impact overall application responsiveness.
Education Technology Performance Standards must accommodate varying network conditions and device capabilities typical in educational environments. Applications should perform acceptably on older devices and slower internet connections while still providing optimal experiences for users with modern infrastructure.
Peak usage periods, such as the beginning and end of academic terms, require applications to handle significant traffic spikes without performance degradation. Load testing should simulate these seasonal usage patterns to ensure adequate capacity planning.
Government and Public Sector Requirements often emphasize accessibility and broad device compatibility over peak performance. Applications must perform adequately across a wide range of devices and network conditions to ensure equitable access to government services.
Security performance requirements in government applications may be more stringent than commercial applications, requiring additional authentication steps and security controls that must be balanced with usability and performance considerations.
Emerging Trends in SaaS Performance Management
The evolution of SaaS performance management continues to accelerate, driven by advances in monitoring technologies, artificial intelligence applications, and changing user expectations. Organizations staying ahead of these trends position themselves to maintain competitive advantages and deliver superior user experiences.
Artificial Intelligence and Machine Learning Integration represents one of the most significant trends reshaping performance management practices. AI-powered monitoring systems can automatically detect performance anomalies, predict potential issues before they impact users, and recommend optimization strategies based on historical data and usage patterns.
Machine learning algorithms analyze vast amounts of performance data to identify subtle patterns and correlations that human analysts might miss. These systems can automatically adjust performance thresholds based on seasonal usage patterns, predict capacity requirements, and optimize resource allocation in real-time.
Predictive performance analytics enable proactive optimization efforts by identifying potential bottlenecks and performance issues before they manifest as user-impacting problems. These capabilities significantly reduce Mean Time to Detection (MTTD) and enable preventive rather than reactive performance management approaches.
Edge Computing Impact on Performance is transforming how SaaS applications are delivered and optimized. Edge computing enables processing capabilities closer to end users, reducing latency and improving response times for geographically distributed user bases.
SaaS applications increasingly implement hybrid architectures that combine centralized cloud processing with edge-based computation for time-sensitive operations. This distributed approach requires new performance monitoring strategies that can track performance across multiple edge locations and coordinate optimization efforts.
Edge computing also enables new approaches to data processing and caching that can significantly improve application performance for users in remote locations or regions with limited network infrastructure. Performance benchmarking must evolve to account for these distributed computing models.
Container and Microservices Performance Optimization reflects the architectural evolution of modern SaaS applications toward more distributed and scalable designs. Performance management for microservices requires sophisticated monitoring capabilities that can track performance across multiple service boundaries and identify bottlenecks in complex service interaction patterns.
Container orchestration platforms provide new opportunities for dynamic performance optimization through automatic scaling, resource allocation, and service routing based on real-time performance metrics. Performance benchmarking must account for the dynamic nature of containerized environments and the rapid scaling capabilities they enable.
Real-Time Performance Analytics enable immediate identification and response to performance issues as they occur. Stream processing technologies allow performance monitoring systems to analyze metrics in real-time and trigger automated responses within seconds of issue detection.
Real-time analytics also enable dynamic performance optimization strategies that can automatically adjust application behavior based on current usage patterns and performance characteristics. These systems can implement automatic load balancing, resource scaling, and traffic routing adjustments to maintain optimal performance during varying usage conditions.
User Experience-Focused Performance Metrics represent a shift toward measuring performance impact from the user perspective rather than focusing solely on technical metrics. Core Web Vitals and similar user experience metrics are becoming increasingly important for performance benchmarking and optimization efforts.
Performance management strategies increasingly incorporate user journey analysis and task completion metrics to understand how technical performance translates to real-world user productivity and satisfaction. This user-centric approach ensures that performance optimization efforts deliver meaningful improvements to actual user experiences.
Integration with DevOps and Site Reliability Engineering (SRE) Practices enables more sophisticated approaches to performance management that integrate performance considerations throughout the development and deployment lifecycle. Performance testing becomes automated and continuous, with performance metrics integrated into deployment pipelines and release decision criteria.
SRE practices like error budgets and service level objectives (SLOs) provide frameworks for balancing performance optimization efforts with feature development and business objectives. These approaches ensure that performance management supports rather than impedes business agility and innovation.
How Binadox Enhances SaaS Performance Monitoring
Binadox provides comprehensive SaaS performance monitoring capabilities that enable organizations to maintain optimal application performance while controlling costs and maximizing user satisfaction. The platform’s integrated approach to performance and cost management offers unique advantages for organizations seeking to optimize their SaaS ecosystems.
Centralized Performance Visibility across all SaaS applications provides organizations with unified insights into performance trends, user utilization patterns, and potential optimization opportunities. Rather than managing multiple monitoring tools for different applications, Binadox enables comprehensive performance oversight from a single platform.
The platform’s dashboard consolidates performance metrics from various SaaS applications, enabling organizations to identify applications that may be underperforming relative to industry benchmarks or internal standards. This centralized visibility supports informed decision-making about performance improvement investments and resource allocation priorities.
Automated Performance Alerting capabilities notify stakeholders when SaaS applications experience performance degradation or availability issues. Custom alert thresholds can be configured based on specific business requirements and user impact levels, ensuring that critical performance issues receive immediate attention while avoiding alert fatigue from minor variations.
Integration with existing incident response workflows enables rapid escalation and resolution of performance issues that could impact business operations or user productivity. Automated reporting capabilities provide stakeholders with regular performance summaries and trend analysis without requiring manual data compilation.
Usage Analytics and Performance Correlation help organizations understand the relationship between application usage patterns and performance characteristics. By analyzing user activity levels, feature utilization, and performance metrics together, organizations can identify opportunities to optimize performance for the most impactful use cases.
Performance data correlation with cost information enables organizations to make informed decisions about performance improvement investments. Understanding the cost implications of performance optimization efforts helps prioritize initiatives based on both user impact and financial considerations.
SaaS Application Benchmarking capabilities enable organizations to compare their application performance against industry standards and similar organizations. This benchmarking provides context for performance improvement efforts and helps identify applications that may require additional optimization attention.
The platform’s analytics capabilities can identify applications with performance characteristics that significantly deviate from industry norms, enabling targeted optimization efforts where they will have the greatest impact on user satisfaction and business outcomes.
Integration with Performance Optimization Workflows enables organizations to incorporate Binadox insights into their existing performance management processes. API integration capabilities allow performance data to be incorporated into custom reporting systems, automated optimization workflows, and business intelligence platforms.
Performance trend analysis helps organizations identify seasonal patterns, growth-related performance challenges, and optimization opportunities that may not be apparent through point-in-time measurements. This longitudinal analysis supports strategic planning for performance improvement initiatives and capacity scaling decisions.
Cost-Performance Optimization represents a unique capability that helps organizations balance performance requirements with cost constraints. By analyzing the relationship between application performance levels and subscription costs, organizations can identify opportunities to optimize spending while maintaining acceptable performance standards.
The platform’s SaaS spend management capabilities enable organizations to evaluate whether performance issues warrant upgrading to higher-tier service plans or whether alternative solutions might provide better cost-performance ratios.
Conclusion
SaaS performance benchmarking has emerged as a critical practice for organizations seeking to maximize the value of their cloud-based application investments while ensuring optimal user experiences. As businesses become increasingly dependent on SaaS solutions for mission-critical operations, maintaining performance standards that meet or exceed industry benchmarks becomes essential for operational success and competitive positioning.
The comprehensive approach to SaaS performance benchmarking outlined in this guide encompasses multiple dimensions of application performance, from technical metrics like response times and availability to user-centric measurements like satisfaction scores and task completion rates. Organizations that implement systematic benchmarking practices gain the visibility and insights necessary to make data-driven optimization decisions that deliver measurable improvements in both user experience and business outcomes.
Industry standards for SaaS performance continue to evolve as user expectations increase and technology capabilities advance. Organizations must stay current with these evolving standards while adapting their benchmarking practices to account for industry-specific requirements and emerging technological trends. The integration of artificial intelligence, edge computing, and advanced analytics capabilities represents the future direction of performance management practices.
Effective SaaS performance benchmarking requires the right combination of tools, processes, and organizational commitment to continuous improvement. Organizations that invest in comprehensive monitoring capabilities, establish clear performance standards, and implement systematic optimization processes position themselves to deliver superior user experiences while maintaining cost-effective operations.
The relationship between performance optimization and cost management remains crucial for organizations seeking to maximize their SaaS investments. Solutions like Binadox that integrate performance monitoring with cost optimization capabilities enable organizations to balance performance requirements with budgetary constraints while identifying opportunities to improve both efficiency and user satisfaction simultaneously.
As the SaaS ecosystem continues to mature and expand, performance benchmarking will remain an essential practice for organizations seeking to harness the full potential of cloud-based applications. By implementing the strategies, standards, and best practices outlined in this guide, organizations can ensure their SaaS applications deliver the performance levels necessary to support business objectives and user satisfaction in an increasingly competitive digital landscape.
The future success of SaaS implementations depends largely on the ability to maintain optimal performance standards while adapting to changing business requirements and technological capabilities. Organizations that prioritize performance benchmarking as a strategic initiative rather than a technical afterthought will be best positioned to realize the transformative potential of SaaS solutions in driving business growth and operational excellence.