Cloud analytics should feel liberating, not nerve‑wracking. Google Cloud’s BigQuery is designed to make analysis almost effortless: it scales instantly, abstracts away infrastructure, and lets teams explore data at the speed of thought. That very ease, however, is why budgets begin to wobble as adoption grows. A few enthusiastic dashboards, a handful of exploratory notebooks, a refresh schedule set to “hourly—just in case,” and suddenly leadership is asking why the invoice jumped. Cost control in BigQuery isn’t about throttling curiosity or pushing analysts back into spreadsheets. It’s about designing your platform and your operating habits so that the number of bytes you scan—and the commitments you buy—stay proportional to the value of the question you’re answering.
This guide brings together practical tactics for BigQuery, a budgeting playbook that finance and engineering can both live with, and a wider view of analytics spend that includes the SaaS tools orbiting your warehouse. Where Google Cloud’s native budgets and labels give you guardrails, a cross‑cloud, cross‑SaaS perspective helps you steer. That’s where a unified platform such as Binadox earns its keep with daily budget visibility, anomaly detection, automation, and a renewals view for the non‑warehouse pieces that quietly affect your analytics total cost of ownership.
The moving parts behind a BigQuery bill
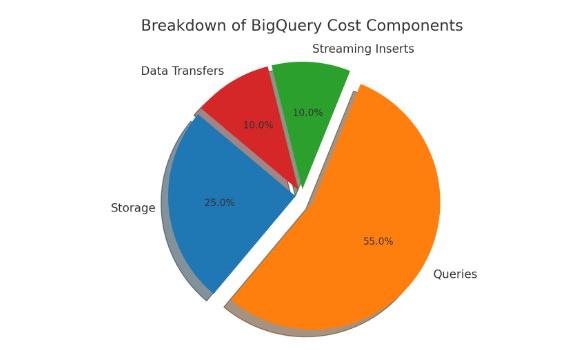
The warehouse bill mostly reflects three motions. Storage grows with your retained data; it becomes cheaper as it ages into long‑term tiers, but the real danger is keeping everything “just in case,” which encourages expensive queries later. Query charges scale with bytes scanned, whether you’re paying on‑demand or under slot commitments; wide tables, broad time windows, and “SELECT *” habits inflate this line fast. Then there are smaller components—streaming inserts, exports, inter‑region transfers—that rarely dominate but are easy to forget. Because query charges are so sensitive to design and habits, the foundational mindset is simple: scan less, scan smarter, and scan on predictable terms.
Thinking in lifecycles helps. Raw feeds land, exploration is noisy, and the temptation to read entire tables is at its peak. As models mature, you narrow columns, codify business logic, and cache expensive steps. Finally, workloads settle into predictable refresh windows. Aligning governance and spend with that arc—permissive at the edge but disciplined at the core—keeps your bill in line with value.
First, install financial guardrails
The quickest wins aren’t fancy SQL tricks; they’re early, visible financial boundaries. Create project‑ or folder‑level budgets in Google Cloud and set threshold alerts so teams get signals before month‑end; pair those with naming standards and labels for projects, datasets, jobs, and reservations so you can attribute spend to teams and products without heroic forensics. Weekly showback reports—lightweight, visual, and shared with the people who trigger the cost—turn numbers into behavior. When product managers see their own dashboards as the source of last week’s spike, they fix cadence and filters without a top‑down mandate.
Native budgets and logs answer “what happened,” but they don’t always prompt action in time. That’s why a single operating view across cloud and SaaS is useful. In Binadox you can track daily budgets, see cost curves at a glance, and configure anomaly alerts that call out unusual BigQuery job costs. The same place shows your Renewals Calendar and License Manager, which means you can line up warehouse commitments with upcoming SaaS negotiations and avoid surprise renewals that crowd out capacity you actually need. If your analytics stack spans AWS, Azure, and Google Cloud, bringing those clouds next to SaaS spend in one dashboard improves conversations about trade‑offs and timing.
Design tables so pruning is automatic
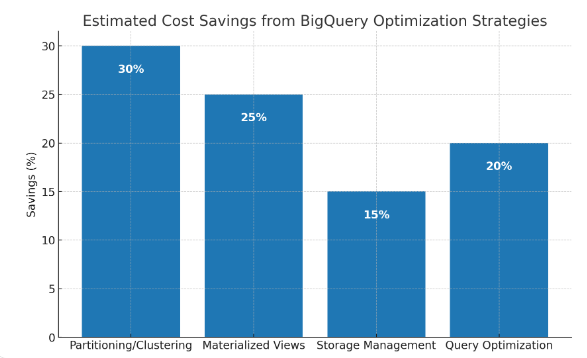
Schema is your first and most durable form of cost control. Partition large fact tables—typically by ingestion or event date at daily granularity—so almost every query naturally limits time. Clustering on fields you commonly filter by (customer, region, product) gives BigQuery even more room to skip blocks inside each partition. Where your event model is naturally nested, keep it that way; ARRAY and STRUCT columns model denormalized events efficiently and often remove the need for join‑heavy queries that read far more than they return.
Retention belongs in table TTLs and dataset policies, not in a spreadsheet. Agree on retention matrices with legal and security, and encode them. Most teams find that ninety percent of day‑to‑day questions concern the last ninety days; design “hot” datasets for that horizon and move older snapshots to an “archive” dataset with long‑term pricing and deliberate access. If an analyst truly needs a long look‑back, they can request a temporary lift rather than having every dashboard quietly scan years of history by default.
Documentation saves money. A one‑page README in each dataset—partition key, clustering columns, expected filters, and common pitfalls—prevents defensive scanning, where an analyst over‑reads because they don’t trust the model. Pair that with a cheat sheet of frugal SQL patterns—how to prune partitions, when to use APPROX_* functions, where to materialize—and you’ll reduce scanned bytes without a single budget meeting.
Build frugality into queries and schedules
Habits drive spend. Production queries should select explicit columns and filter partitions; “SELECT *” belongs in a sandbox, not a dashboard. Push filters down before joins, pre‑aggregate the larger side, and use parameters so viewers don’t accidentally query whole years. Heavy analyses should do the expensive work once and persist a smaller result set for downstream exploration. Teach teams to read EXPLAIN plans; a quick glance at estimated bytes often changes a query before it runs.
Materialization and caching are multipliers. If a dashboard repeats the same query, write it on a cadence that matches source freshness; if data lands daily, refreshing hourly wastes money and adds noise. Temporary tables keep iterative analysis from re‑reading huge base tables. When several teams repeat the same business logic, prefer authorized views or shared models over copy‑pasted CASE statements that drag in columns “just in case.” These are engineering courtesies; they are also budget controls.
Scheduling deserves adult supervision. Many pipelines run far more often than the business needs because “hourly” feels safe. Put every recurring job on an explicit SLA for freshness, define an owner, and set cadence to the minimum that satisfies that promise. If the SLA truly requires hourly refresh, fine—now you have a reason to invest in slot reservations sized to finish on time.
Match purchases to the shape of your workload
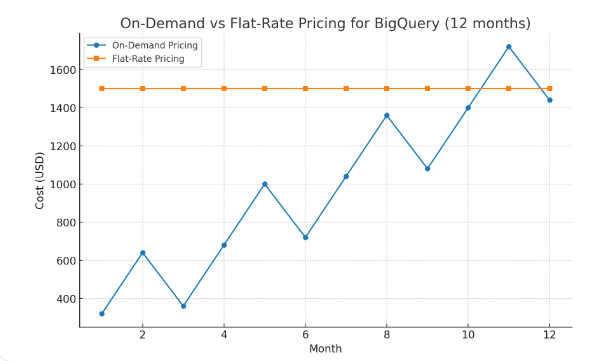
On‑demand pricing is fantastic for spiky, ad‑hoc work; it’s volatile for steady refreshes. Most analytics teams end up with a hybrid: a baseline of flat‑rate slots or reservations sized to their critical path, and a buffer of on‑demand capacity to absorb peaks. Separate reservations for production and experimentation prevent a burst of ad‑hoc work from starving critical jobs. Review commitments monthly; you’ll almost always learn something about cadence that lets you tighten or loosen.
Remember that BigQuery rarely sits alone. If you push transformations into an ETL SaaS tool to “save” warehouse compute, you might raise your SaaS bill because that vendor charges per connector or rows processed. If you offload to BigQuery, you might be able to drop a pricey integration tier. Decisions like these only make sense if cloud costs share a frame with SaaS costs. Binadox’s single‑pane view puts your cloud providers next to application spend, visualizes license utilization, and anchors those numbers in a Renewals Calendar so you can sequence commitments intelligently.
Treat analytics as a product—with cost SLOs
Cost discipline sticks when analytics moves from “project” to “product.” Appoint owners, publish roadmaps, and define SLOs that include cost alongside freshness and latency. “No dashboard refresh scans more than 20 GB” or “the marketing sandbox may not exceed €X per week without approval” are the kind of rules that guard the budget without micromanaging individuals. Bake those SLOs into code review checklists and, where feasible, into automated policy. When someone proposes a heavy new job, ask for a one‑paragraph cost justification: the decision it enables, the scan it requires, and the cheaper alternatives considered.
Education is part of product management. Give new analysts a thirty‑minute tour of BigQuery’s cost model and a few before‑and‑after stories from your environment. Celebrate wins—“we cut this dashboard by 70% with partition pruning and a materialized view”—in the same channels where you cheer latency improvements. When frugal patterns are social norms, engineers invent better ones.
Observe spend like you observe performance
You need a spend narrative, not just a number. Label every scheduled query with team, product, environment, and a ticket or feature ID; route audit logs into a “meta” dataset and model how jobs map to dashboards and pipelines. Then publish a handful of executive views: most expensive queries this week, biggest movers by job family, bytes scanned by dataset. This is not for blame; it’s to help owners fix their slice of the problem quickly.
Anomalies are where you save real money. Spend always wiggles; you care about spikes and drifts that are statistically unusual. Tools that learn your baseline and call out deviations reduce the time from “something’s off” to “we’ve fixed it.” In Binadox, Cost Explorer visualizes spikes, while Automation Rules can notify owners or even pause non‑critical jobs while you investigate. The Additional Advice and Issues scans help catch misconfigurations and hygiene problems—like untagged cloud resources—that quietly inflate bills or create risk. If you’re shifting infrastructure definitions into Terraform, blending governance with cost forecasts pays off; an IaC Cost Tracker approach helps you understand the financial impact of infrastructure changes before they land.
Tame storage before it tames you
Storage rarely dominates BigQuery bills, but messy storage creates waste everywhere else. Adopt a simple lifecycle: raw landings with short TTLs, curated “gold” tables with partitions and clustering, and long‑term archives with limited access. Publish and enforce a retention matrix per domain. If a dataset has no owner, archive it. If a dashboard hasn’t been viewed in sixty days, retire it. Duplicating the same fact table across projects so each team can iterate in isolation is convenient; it also triples the chance that a “full refresh” rescan explodes costs. Balance file granularity: many tiny files slow metadata operations; huge partitions blunt pruning. Document trade‑offs so well‑meaning refactors don’t undo efficiency.
Tie spend to value and reduce the noise
An analytics euro should defend itself by the revenue or savings it unlocks. Tie every major dataset and dashboard to an owner and a hypothesis: what decision does it inform, and how often? Put that context next to the cost in your operational views. When a product manager can say “this cohort analysis powered a €120K uplift,” budgets become conversations about return, not austerity. When nobody can explain a dashboard’s purpose, archive it. The side effects are healthy: fewer metrics, clearer stories, and a calmer cadence of change.
Showback and chargeback are cultural tools. Even if you never invoice teams, giving them a living view of consumption—normalized by their user base or revenue—nudges better behavior. In multi‑country, multi‑currency settings, you’ll make faster progress if you consolidate invoices in original currencies and convert to a single reporting currency for all dashboards; platforms that automate this remove friction and give you a trustworthy single source of truth for budget discussions.
A short case study: turning runaway growth into predictable value
A retailer moved from an on‑premises warehouse to BigQuery and enjoyed an explosion of new dashboards. Six months later, the cloud bill had quintupled. A joint review by finance and engineering surfaced classic patterns. Marketing refreshed a heavy attribution model every hour even though sources landed once a day. Data scientists iterated in notebooks that repeatedly scanned the full orders table with “SELECT *.” Two departments had cloned the same events dataset into separate projects “for safety,” and each ran nightly “full rebuilds.” No one owned the spend narrative, so every spike surprised everyone.
The fix paired governance and engineering. The platform team defined cost SLOs, enforced labels in the scheduler, and changed default query templates to include partition filters. They partitioned major facts by event date and clustered by customer, then materialized common aggregates as shared views. A modest slot reservation—sized to the pipeline’s critical path—replaced pure on‑demand usage; ad‑hoc work moved to a sandbox project with a weekly budget and alerting. They built a “meta” dataset of job logs and published a simple set of spend views: top queries, top movers, bytes by dataset.
In parallel they adopted a unified spend view. Binadox flagged anomalies as tuning progressed, and its Renewals Calendar reminded the team that a high‑tier BI license with low utilization was up next month. By rightsizing that license and removing abandoned seats via License Manager, they funded the BigQuery reservation without raising the overall analytics budget. Three months later, bytes scanned had fallen by 38 percent, average dashboard refresh times improved, and the total analytics bill dropped by nearly a third—while stakeholder satisfaction rose because SLOs were explicit and met.
Situate BigQuery cost work inside SaaS governance
Warehouse optimization lives inside a larger discipline: governing the sprawl of SaaS around your data stack. Centralized SaaS procurement, periodic audits, and rightsizing subscriptions remove overlapping tools and abandoned licenses that quietly inflate spend and emit unnecessary data into your warehouse. These are exactly the controls that platforms like Binadox put at your fingertips—Users and utilization views to spot abandoned seats, Teams and tagging to segment costs, and a Renewals Calendar so upcoming commitments don’t catch you off guard. Viewed together with cloud budgets in a single Cloud Utilization Dashboard, you get one truth for the whole analytics estate.
The wider market trends reinforce this convergence. Vertical‑specific SaaS makes it easier to buy tools that fit your niche, but it fragments spend unless you have governance. AI and machine learning inside analytics products help you predict workload peaks and even generate more efficient SQL, yet they also encourage exploration; guardrails have to keep pace. Edge processing summarizes data closer to its source, reducing the volume and granularity you need to push into BigQuery; a hybrid of edge logic and warehouse analytics often yields a better latency‑to‑cost trade‑off for real‑time cases. If your stakeholders need a refresher on the terminology behind these choices, point them to a short explainer such as our Basic Cloud Computing Terminology guide, which helps non‑engineers participate in cost conversations with confidence (read it here) . For a broader perspective on how macro shocks changed cloud adoption patterns—and why SaaS governance matters more than ever—our note on the COVID‑19 impact on the technology sector remains a useful reference (read it here) .
A month‑one implementation roadmap
You don’t need a transformation program to make progress; a month of focused work builds momentum. Start by turning on budgets and threshold alerts for each analytics project, enforcing labels in schedulers, and teaching analysts to read EXPLAIN plans. In your second sprint, partition and cluster the heaviest unpartitioned tables, and replace any hourly refresh that doesn’t need to be hourly with a daily job that writes to a materialized table or view. In your third sprint, introduce a small reservation sized to your pipeline’s critical path and move ad‑hoc exploration into a sandbox project with a weekly budget and alerts. Place everything under a single operating view so you can watch the trendlines and catch anomalies. In Binadox, you’ll find Cost Explorer, Automation Rules, Additional Advice, and an Issues scanner helpful for surfacing risk and waste hot spots quickly; if infrastructure as code is part of your roadmap, bring cost estimation into those pipelines so you understand changes before they hit production.
If you’d like a guided walkthrough of these controls in a live environment—and how cloud and SaaS spend roll up together—consider scheduling a product demo. It’s a fast way to see how dashboards, renewals, and alerts fit into your day‑to‑day workflow, and to ask implementation questions in your own context.
Conclusion
BigQuery gives you a rare combination: the power to think in questions rather than servers, and the ability to pay only for what you use. Costs become unpredictable when schema design, job cadence, and purchasing don’t respect the economics of scanned bytes and commitments. The antidote is an operating model you can sustain: set budgets and labels so accountability is visible; shape tables for pruning; make frugality the default in queries and schedules; and match reservations to the real shape of your work. Treat analytics as a product with owners and SLOs—including cost SLOs—and observe spend with the same rigor you bring to latency and uptime.
Above all, stop managing the warehouse in isolation. The total cost of insight spans cloud services and the SaaS tools that create and consume data. When you can see the whole picture—cloud and SaaS spend, license utilization, renewals, anomalies, risks—in one place, budgeting becomes a confident, continuous conversation. Google Cloud’s native guardrails provide the foundation. Platforms like Binadox add the cross‑cloud, cross‑SaaS context, automation, and practical recommendations you need to keep BigQuery fast, your analytics credible, and your budget on purpose.