Modern enterprises use an average of 80 SaaS applications across their operations, yet most CFOs struggle to answer basic questions about their software investments. How much are we actually spending on subscriptions? Which applications deliver the highest ROI? Are we paying for licenses that nobody uses?
The challenge isn’t just about SaaS cost optimization – it’s about having the right visibility to make informed decisions. While traditional financial reporting focuses on quarterly summaries and annual budgets, SaaS spending requires real-time monitoring and predictive analytics.
The explosion of subscription management platforms has created a new category of business intelligence that CFOs must master. Unlike traditional software purchases with one-time payments, SaaS subscriptions create ongoing financial commitments that compound over time without proper oversight.
Consider this scenario: A mid-sized company discovers they’re paying for 200 Slack licenses when only 150 employees actually use the platform. Meanwhile, their development team has subscribed to three different project management tools, each with overlapping functionality. These inefficiencies can easily cost organizations 20-30% more than necessary on their SaaS budget control initiatives.
Why Traditional Financial Dashboards Fall Short for SaaS
Traditional financial dashboards were designed for predictable, fixed costs – office rent, utilities, equipment purchases. SaaS spending operates fundamentally differently, creating unique challenges that conventional financial reporting can’t address effectively.
The Subscription Complexity Problem
Unlike traditional software licenses, SaaS subscriptions often include variable pricing tiers, user-based scaling, feature add-ons, and usage-based billing. A single application might have costs that fluctuate monthly based on active users, data consumption, or feature utilization. Traditional accounting systems treat these as simple recurring expenses, missing the nuanced optimization opportunities.
The Renewal Risk Blind Spot
Most CFO dashboards show current monthly or quarterly spending but fail to highlight upcoming renewal dates and their associated costs. This reactive approach leads to last-minute negotiations, missed cancellation windows, and automatic renewals of unused subscriptions. Smart SaaS cost control requires proactive visibility into future commitments.
The Hidden Usage Reality
Traditional dashboards might show that a company spends $10,000 monthly on Salesforce, but they don’t reveal that 40% of licensed users haven’t logged in during the past 90 days. This usage blindness prevents optimization decisions and creates a false sense of value delivery from software investments.
The Shadow IT Challenge
Department heads and team leaders often subscribe to SaaS tools using corporate credit cards or personal accounts, creating subscription management challenges that traditional procurement processes can’t capture. These shadow IT subscriptions can represent 20-40% of total SaaS spending while remaining invisible to executive dashboards.
The 8 Critical SaaS Metrics Every CFO Dashboard Must Include
Effective SaaS spend management requires tracking specific metrics that directly impact financial performance and operational efficiency. Here are the eight essential metrics that every executive dashboard must include:
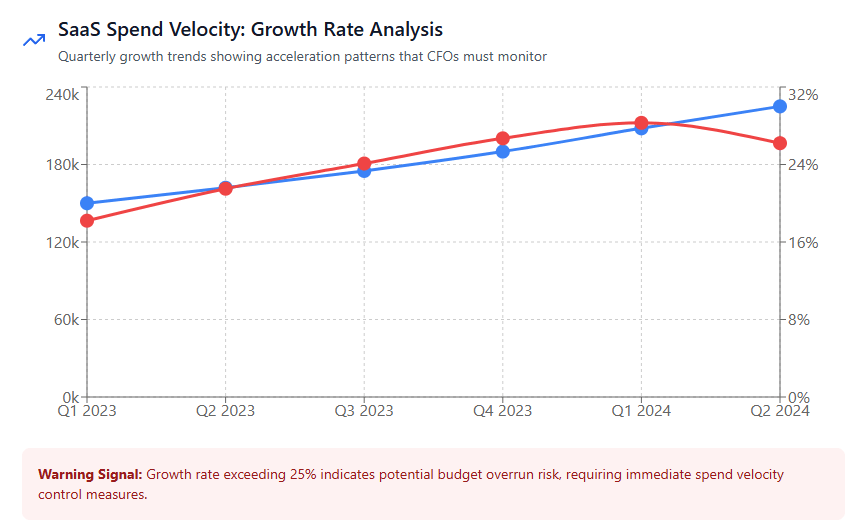
1. Total SaaS Spend Velocity
This metric tracks the rate of SaaS spending growth over time, not just current expenses. It includes new subscriptions, upgrades, downgrades, and cancellations to provide a complete picture of spending trajectory. CFOs use this metric to forecast budget requirements and identify spending acceleration patterns.
Why it matters: A company might show stable monthly SaaS costs of $50,000, but if spend velocity reveals 15% month-over-month growth, they’re on track for $100,000 monthly expenses within a year.
2. License Utilization Rate
This metric measures the percentage of paid licenses actually being used across all SaaS applications. It’s calculated by dividing active users by total licensed seats, providing a direct measure of subscription efficiency.
Industry benchmark: Leading organizations maintain 85-95% license utilization rates through active SaaS license optimization practices.
3. Cost Per Employee
This normalized metric divides total SaaS spending by employee count, enabling comparison across time periods and industry benchmarks. It helps CFOs understand whether SaaS investments scale appropriately with business growth.
Strategic value: Companies spending significantly above industry averages can identify optimization opportunities, while those below average might be missing productivity-enhancing tools.
4. Renewal Risk Exposure
This forward-looking metric quantifies the financial risk from upcoming renewals, including subscriptions that might be cancelled, downsized, or face significant price increases. It provides a 12-month view of potential spending volatility.
Practical application: If $200,000 in subscriptions renew next quarter but utilization data suggests $60,000 worth could be cancelled, CFOs can proactively plan budget adjustments.
5. Application Redundancy Score
This metric identifies overlapping functionality across the SaaS portfolio, measuring both direct duplicates (multiple video conferencing tools) and indirect overlaps (separate tools that could be consolidated into platform solutions).
Cost impact: Organizations typically reduce SaaS spending by 15-25% through redundant app cost reduction initiatives guided by redundancy scoring.
6. Security and Compliance Risk Rating
This metric assesses the security posture and compliance status of the entire SaaS portfolio, including factors like data location, encryption standards, access controls, and vendor certifications.
Executive relevance: CFOs increasingly face board-level questions about data security and regulatory compliance across software vendors, making this metric crucial for risk management.
7. ROI by Application Category
This metric calculates return on investment for different categories of SaaS applications – productivity tools, customer relationship management, marketing automation, etc. It helps prioritize software investments and identify underperforming categories.
Decision-making value: Rather than making across-the-board cuts, CFOs can make data-driven decisions about which application categories deliver the highest business value.
8. Budget Variance and Forecast Accuracy
This metric tracks how actual SaaS spending compares to budgeted amounts and measures the accuracy of spending forecasts. It includes variance analysis for both individual applications and total portfolio spending.
Financial planning impact: Improving forecast accuracy from 70% to 90% can significantly enhance budget reliability and strategic planning capabilities.
Building Executive-Ready SaaS Dashboards
Creating dashboards that executives actually use requires balancing comprehensive data with clear, actionable insights. The most effective SaaS dashboards follow specific design principles that prioritize strategic decision-making over operational details.
Dashboard Architecture for Executive Consumption
Executive dashboards should follow a three-tier information hierarchy: strategic overview, tactical insights, and operational details. The main view presents high-level metrics and trends, with drill-down capabilities for deeper analysis when needed.
Strategic Overview Layer: This top-level view displays the eight critical metrics in visual formats that enable quick assessment. Trend lines, comparison charts, and alert indicators help executives identify areas requiring attention without diving into detailed data.
Tactical Insights Layer: This second level provides context for strategic metrics, including department-level breakdowns, vendor performance comparisons, and optimization opportunities. This layer bridges high-level trends with actionable recommendations.
Operational Details Layer: The bottom layer contains detailed transaction data, user-level utilization statistics, and technical configurations. While executives rarely need this level of detail, it provides the foundation for tactical insights and enables investigation of specific issues.
Visual Design Principles for Financial Dashboards
Cost-effective SaaS tools dashboards must communicate complex financial information quickly and accurately. Color coding, chart types, and layout decisions significantly impact executive comprehension and decision-making speed.
Color Psychology for Financial Data: Red indicates over-budget conditions, declining utilization, or security risks. Green represents on-target performance, growing efficiency, or successful optimizations. Yellow highlights areas requiring attention or upcoming decisions. This consistent color scheme enables rapid pattern recognition across different metrics.
Chart Selection Strategy: Time-series charts work best for spending trends and forecasts. Bar charts effectively compare spending across departments or applications. Heat maps reveal usage patterns and identify optimization opportunities. Gauge charts provide quick status updates for key performance indicators.
Real-World Examples: What Good SaaS Dashboards Look Like
Understanding theoretical metrics is valuable, but seeing how successful organizations implement these concepts provides practical guidance for dashboard development.
Case Study: Mid-Size Technology Company
A 500-employee software company implemented comprehensive SaaS analytics for startups principles as they scaled. Their CFO dashboard includes:
Primary Metrics Display: A clean interface showing total monthly SaaS spend ($85,000), month-over-month growth rate (8%), and license utilization across all applications (78%). These metrics immediately communicate spending trajectory and efficiency opportunities.
Department Breakdown: Engineering represents 45% of SaaS spending ($38,250), followed by Sales (25%, $21,250) and Marketing (20%, $17,000). This breakdown enables department-specific optimization discussions and budget allocation decisions.
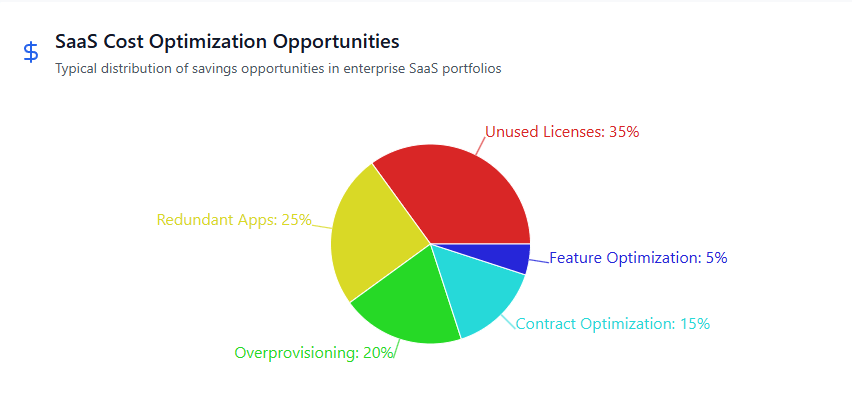
Optimization Opportunities: The dashboard highlights $12,000 in monthly savings opportunities through unused license cancellation, application consolidation, and plan downgrades. Each opportunity includes implementation difficulty and potential business impact.
Risk Indicators: Upcoming renewals worth $180,000 over the next six months, with risk ratings based on utilization data and business criticality. Security compliance scores for each major application, highlighting potential audit concerns.
Case Study: Global Financial Services Firm
A multinational financial services company with 5,000 employees manages over 200 SaaS applications across multiple regulatory environments. Their executive dashboard emphasizes compliance and risk management alongside traditional financial metrics.
Regulatory Compliance Overview: The dashboard displays compliance status across different jurisdictions – GDPR, SOX, PCI-DSS – with color-coded indicators for each SaaS application. This view enables rapid assessment of regulatory risk exposure.
Vendor Risk Assessment: Each major SaaS vendor receives a comprehensive risk score based on financial stability, security certifications, data handling practices, and contract terms. This information supports vendor management and continuity planning decisions.
Cost Optimization Results: The dashboard tracks savings achieved through transparent SaaS management initiatives, showing $2.3 million in annual savings through license optimization, contract negotiations, and application consolidation.
Advanced Metrics for Mature SaaS Operations
Organizations with sophisticated SaaS portfolios require additional metrics that go beyond basic cost and utilization tracking. These advanced metrics provide deeper insights into software portfolio performance and strategic value creation.
SaaS Portfolio Performance Indicators
Application Lifecycle Metrics: These metrics track the journey of SaaS applications from initial adoption through optimization or retirement. Key indicators include time-to-value for new applications, feature adoption rates, and end-of-life planning status.
Integration Complexity Scoring: Modern SaaS environments require extensive integration between applications. This metric assesses integration density, data flow efficiency, and technical debt accumulation across the software portfolio.
Vendor Concentration Risk: This metric evaluates financial exposure to individual SaaS vendors, including single points of failure, contract concentration, and alternative solution availability. It helps CFOs understand and mitigate vendor dependency risks.
Predictive Analytics for SaaS Spending
Demand Forecasting Models: Advanced organizations use machine learning algorithms to predict future SaaS requirements based on business growth, seasonal patterns, and historical usage trends. These models improve budget accuracy and procurement planning.
Churn Prediction Analytics: By analyzing usage patterns, support ticket volumes, and user engagement metrics, organizations can predict which SaaS subscriptions are at risk of non-renewal or downsizing.
Optimization Impact Modeling: These models simulate the financial and operational impact of various optimization scenarios, helping executives evaluate trade-offs between cost savings and business capabilities.
How Modern CFOs Use SaaS Analytics for Strategic Decisions
The most successful CFOs leverage SaaS spend analytics not just for cost control, but for strategic business decisions that drive competitive advantage and operational excellence.
Strategic Investment Decisions
Modern CFOs use SaaS cost monitoring platforms to evaluate software investments with the same rigor applied to traditional capital expenditures. This approach includes ROI calculations, payback period analysis, and total cost of ownership assessments that account for implementation, training, and ongoing management costs.
Portfolio Optimization Strategy: Rather than managing individual application costs, leading CFOs optimize their entire SaaS portfolio for maximum business value. This might involve consolidating point solutions into platform solutions, standardizing on strategic vendor relationships, or investing in integration capabilities that increase overall portfolio efficiency.
Market Response Capabilities: SaaS analytics enable rapid response to market changes. During economic downturns, CFOs can quickly identify non-essential subscriptions for cost reduction. During growth periods, usage trend data helps predict when to scale software investments to support business expansion.
Operational Excellence Through Data
Department Performance Correlation: Advanced CFOs correlate SaaS utilization data with department performance metrics to identify productivity drivers and optimization opportunities. High-performing teams often demonstrate specific software usage patterns that can be replicated across the organization.
Change Management Insights: SaaS analytics provide valuable insights into how employees adapt to new software implementations. User adoption curves, feature utilization patterns, and support ticket trends inform change management strategies and training program development.
Vendor Relationship Management: Data-driven vendor discussions replace traditional negotiation approaches. CFOs use utilization data, performance metrics, and competitive analysis to negotiate better terms, secure volume discounts, and establish performance-based contract structures.
Common Dashboard Mistakes That Lead to Poor Decisions
Even well-intentioned SaaS dashboard implementations can fail to deliver value if they fall into common design and implementation traps. Understanding these pitfalls helps organizations build more effective executive reporting systems.
Data Overload and Analysis Paralysis
Too Many Metrics: The most common mistake is including every available metric rather than focusing on the eight critical measurements that drive decisions. Cluttered dashboards reduce executive engagement and dilute focus from key optimization opportunities.
Lack of Context: Presenting metrics without industry benchmarks, historical trends, or business context limits their decision-making value. A 15% license utilization rate might be concerning for productivity software but acceptable for specialized tools used by small teams.
Missing Actionability: Dashboards that highlight problems without suggesting solutions create frustration rather than value. Effective dashboards combine problem identification with specific, prioritized recommendations for improvement.
Technical Implementation Failures
Poor Data Quality: Inaccurate or incomplete data undermines dashboard credibility and leads to poor decisions. Common data quality issues include duplicate records, inconsistent vendor names, and missing usage information from applications that don’t provide detailed analytics.
Update Frequency Misalignment: Some metrics require real-time updates while others are meaningful on weekly or monthly cycles. Misaligned update frequencies either overwhelm users with constant changes or provide stale information when timely decisions are needed.
Integration Complexity: Overly complex integration requirements can delay dashboard implementation and increase maintenance costs. Successful dashboards balance comprehensiveness with practical implementation constraints.
Implementing SaaS Spend Dashboards with Binadox
Organizations seeking to implement comprehensive subscription management platforms face significant technical and organizational challenges. Binadox addresses these challenges through purpose-built SaaS spend management capabilities that deliver executive-ready dashboards without extensive custom development.
Comprehensive SaaS Discovery and Integration
Binadox automatically discovers SaaS applications across your organization through multiple detection methods – credit card analysis, email receipt scanning, network traffic analysis, and direct API integrations. This comprehensive approach ensures complete visibility into both sanctioned and shadow IT subscriptions.
The platform integrates with over 40 major SaaS applications, automatically importing usage data, billing information, and user details. For applications without direct integrations, Binadox provides flexible data import capabilities and manual tracking tools that maintain complete portfolio visibility.
Executive Dashboard Features
Real-Time Metrics Display: Binadox dashboards present the eight critical SaaS metrics in executive-friendly formats with customizable views for different organizational roles. CFOs see strategic overviews while IT managers access operational details, all from the same underlying data platform.
Predictive Analytics: The platform includes forecasting capabilities that predict future SaaS spending based on usage trends, contract terms, and business growth patterns. These predictions help CFOs plan budgets and identify potential cost overruns before they occur.
Optimization Recommendations: Binadox analyzes your complete SaaS portfolio to identify specific optimization opportunities, quantify potential savings, and prioritize recommendations based on implementation difficulty and business impact.
Automated Cost Control Features
Renewal Management: The platform tracks all SaaS subscription renewal dates and provides proactive notifications with usage analysis and recommendations for each upcoming renewal. This automation prevents surprise renewals and enables strategic contract negotiations.
License Optimization: Binadox continuously monitors license utilization across all applications and provides specific recommendations for license adjustments, including which users to remove, when to downgrade plans, and opportunities for volume discounts.
Budget Alerts: Customizable spending alerts notify CFOs when departments exceed budget thresholds, when application costs increase unexpectedly, or when usage patterns suggest optimization opportunities.
Security and Compliance Management
Modern SaaS portfolios create complex security and compliance challenges that require ongoing monitoring and management. Binadox addresses these challenges through comprehensive vendor risk assessment and compliance tracking capabilities.
Vendor Risk Scoring: The platform maintains updated security and compliance profiles for major SaaS vendors, including certifications, audit reports, and security incident histories. This information supports vendor evaluation and ongoing risk management processes.
Data Location Tracking: For organizations with regulatory requirements around data location and sovereignty, Binadox tracks where each SaaS application stores and processes data, enabling compliance with GDPR, CCPA, and other privacy regulations.
Access Control Monitoring: The platform monitors user access patterns across SaaS applications, identifying potential security risks from inactive accounts, excessive permissions, or unusual access patterns.
Conclusion
The transformation of software delivery from on-premises installations to SaaS subscriptions has fundamentally changed how CFOs must approach technology spending management. Traditional financial reporting tools and methods are inadequate for managing the complexity, variability, and strategic importance of modern SaaS portfolios.
Successful SaaS cost optimization requires purpose-built analytics platforms that provide the eight critical metrics every CFO needs: total SaaS spend velocity, license utilization rates, cost per employee, renewal risk exposure, application redundancy scores, security and compliance risk ratings, ROI by application category, and budget variance analysis.
The most effective executive dashboards balance comprehensive data with clear, actionable insights that support strategic decision-making. They avoid common pitfalls like data overload, lack of context, and poor integration quality while providing the predictive analytics and optimization recommendations that modern CFOs require.
Organizations that implement sophisticated smart SaaS cost control systems achieve significant competitive advantages through improved budget accuracy, reduced software waste, enhanced security posture, and more strategic technology investments. These benefits compound over time as data quality improves and optimization processes mature.
By focusing on the metrics that actually drive business decisions and implementing dashboards that executives will actively use, CFOs can transform SaaS spending from a cost center into a strategic capability that supports business growth and operational excellence. The key is combining the right metrics, effective visualization, and automated optimization recommendations in a platform that scales with organizational complexity and business requirements.
With Binadox, organizations can quickly implement these best practices without extensive custom development, ensuring that CFOs have the visibility and control they need to optimize SaaS investments while supporting business objectives and maintaining operational efficiency in an increasingly software-driven business environment.