Proxy Integration: Catch Every Request at the Network Level
Binadox Proxy Integration captures web traffic at the network level — no software needed on endpoints. Every device that connects to the network is covered, including guest machines and personal devices.
How it connects
The proxy is a small service you get and run using Docker. Once it’s started, it acts as a regular web proxy that listens on a specific network port.
There are two sets of settings. One set is for the basic proxy behavior (like rules, caching, and secure connections). The other set includes Binadox-specific details such as where to send data, your account key, and how often to upload data.
To work correctly, each user’s device needs two things: the browser or system must be set to use the proxy, and the device must trust the proxy’s security certificate. That certificate is needed because the proxy briefly decrypts secure web traffic so it can see full page addresses. Without it, users would see security warnings on secure sites.
Core functionality
Traffic interception
The proxy receives every web request from client machines. For secure websites, it temporarily handles the secure connection so it can observe the full web address being requested rather than just the site name.
URL extraction
As people browse, the system notes each web address they visit and which device made the request. These visit records are collected and sent to the Binadox service in short batches on a regular interval.
Login detection
The system also watches for login events — such as when someone submits a login form or signs in through a single sign-on flow. When it detects a login, it sends that event right away, providing near real-time insight into who is signing into what.
Key features:
- Docker deployment: One container, one command. All dependencies included.
- SSL bump with custom CA support: Per-site certificates generated on the fly. Bring your own CA or use the auto-generated one.
- Flexible ACLs: Restrict access by subnet, block domains, or apply any Squid-supported rules.
- Transparent proxy mode: Intercept traffic without configuring individual clients.
Optimization and automation
Once the proxy is running, discovery is continuous and automatic. Every web request from every connected client generates data. The eCAP plugin batches visited-site events and flushes them every 60 seconds, keeping API call volume predictable regardless of how many clients are connected.
You can connect the discovery data to ticketing systems through Binadox. When a new unauthorized SaaS application appears in the traffic, it triggers a ticket in Zendesk or Jira automatically. The ticket includes the domain, the client IPs that accessed it, and the first-seen timestamp.
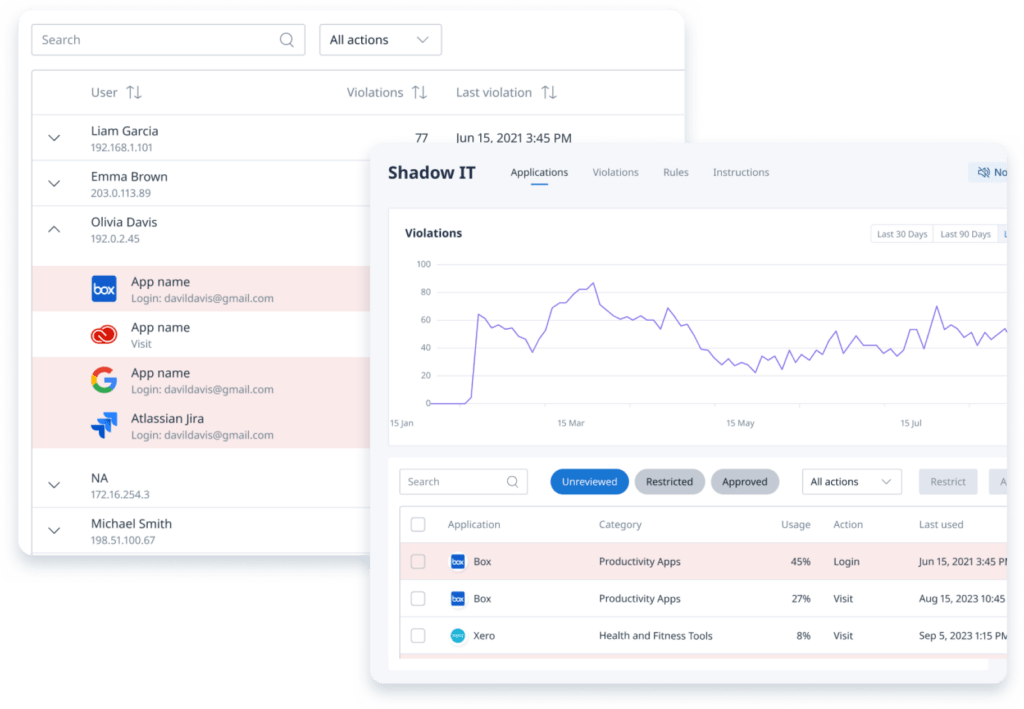
The proxy data merges with data from the Browser Extension and Desktop Agent on the Binadox platform. If you’re using all three, the Shadow IT dashboard shows a combined view with source attribution — so you can see whether an app was detected via proxy traffic, browser extension login events, agent history scanning, or some combination.
For organizations that prefer not to install anything on endpoints, the proxy can be the only discovery source. It won’t catch login usernames the way the extension does (the proxy sees the target URL but not the form field contents in most cases), but it will catch every domain and URL path.
How it works
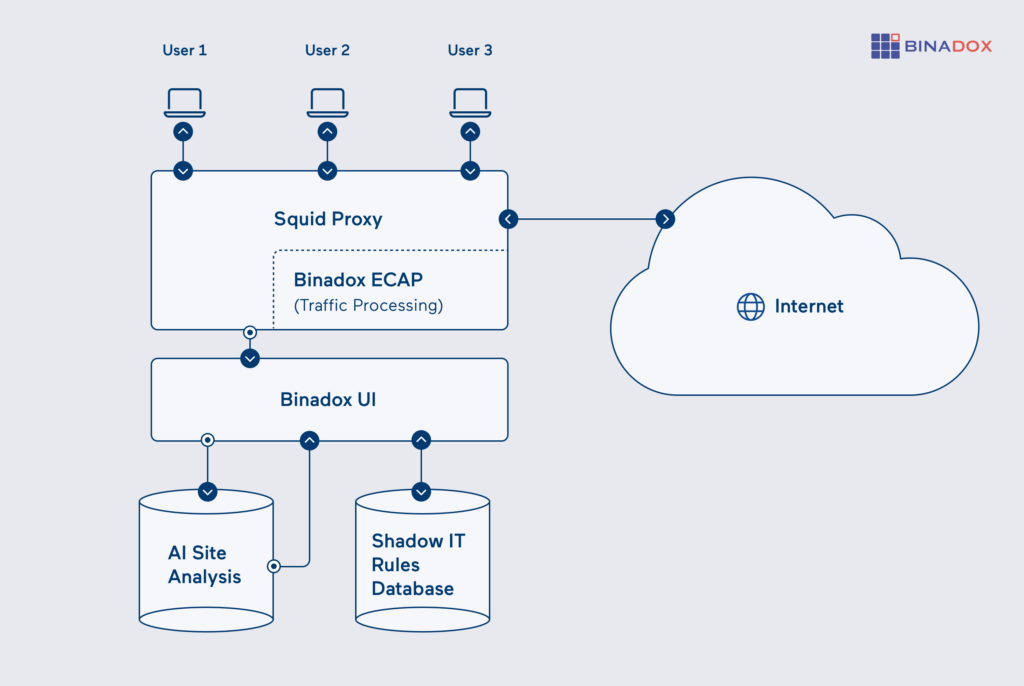
Employee-initiated web traffic goes first to a proxy server, then out to the Internet. All browser requests from user machines are routed through this proxy, which connects to the target site and sends the response back to the user.
As traffic passes through, the Binadox plugin inside the proxy picks out the sites people visit and detects login actions. Visited site addresses are grouped together and sent to the Binadox service every minute. Login events are reported immediately. All data sent to the service is compressed and secured using a proxy authentication token.
Once the data reaches the Binadox platform, it is compared against a database of known SaaS applications and any custom rules your organization has. Recognized services are labeled with their category and whether they’re approved. Unknown or unrecognized domains are flagged for review.
Access and permissions
- Network access: Client machines need to be able to reach the proxy on a specific network port (commonly port 3128, but this can be changed). If you’re using transparent network routing, the proxy must be placed in the traffic path so that devices send their web traffic through it.
- SSL interception: To inspect secure (HTTPS) traffic without browser warnings, all client machines must trust the proxy’s own security certificate. In managed environments, this certificate is usually installed automatically through group policies (GPO) or device management tools (MDM).
- Container permissions: The proxy runs inside a container. It includes all required components bundled together. Persistent items (like certificates, logs, and internal data) are stored on the host system so they aren’t lost when the container restarts.
- API authentication: When the proxy reports data to the Binadox service, it authenticates using a secure API key included in its settings. This ensures only authorized proxies can send information.
Licensing and requirements
- Infrastructure: Docker Engine 20.10+ and Docker Compose v2+. The container runs on any host that meets these requirements. A single instance handles traffic from a typical office network.
- Client setup: Each client machine needs the proxy configured (browser or system-level) and the CA certificate installed. Transparent mode eliminates the proxy configuration but still requires the CA cert for HTTPS.
- Network: Outbound HTTPS from the proxy to the Binadox API. Inbound connections from clients on port 3128.
- Scaling: For high-traffic environments, run multiple proxy containers behind a load balancer. Each instance runs independently.
- Binadox plan: The Proxy Integration is part of the Network & System Management module. Check the pricing page for details.
Get Network-Wide SaaS Visibility with Binadox Proxy Integration
The Proxy Integration is the third discovery method in Binadox, and it’s the only one that doesn’t touch employee machines at all. Deploy a Docker container, route your network traffic through it, and every SaaS application that anyone on your network visits starts showing up in the dashboard.
It works best in combination with the other two agents: the proxy covers the network, the extension covers logins, and the desktop agent covers history. But it also works fine on its own if you want a single point of visibility without touching endpoints.
Setup takes about an hour — most of that is deploying the CA certificate to client machines. After that, it runs by itself.