



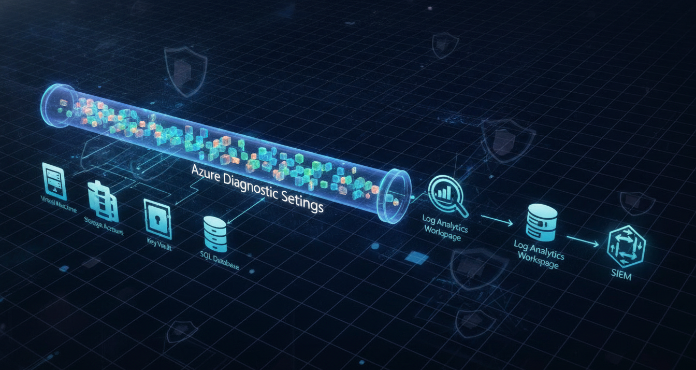
Ensuring you have a complete, uninterrupted view of your cloud environment is essential for security, operations, and compliance. For any team running resources on Microsoft Azure, this starts with a fundamental, yet often overlooked, service: Azure Diagnostic Settings. These settings are the control plane for exporting platform logs and metrics from your Azure resources to the destination of your choice. Without proper configuration, you create significant blind spots, leaving your team in the dark when an incident occurs. Therefore, mastering these configurations is a critical step toward achieving robust observability and security posture management.
Key takeaways:
- Azure Diagnostic Settings control the export of platform logs and metrics for most Azure services.
- You can route diagnostic data to one of three primary destinations: a Log Analytics workspace, an Azure Storage account, or Azure Event Hubs.
- Failing to configure these settings for every resource results in critical visibility gaps, hindering incident response and security analysis.
- Automating the deployment of diagnostic settings using Azure Policy is the most effective way to ensure 100% logging coverage across your environment.
What Are Azure Diagnostic Settings?
Azure Diagnostic Settings are the primary mechanism for routing resource-specific logs and metrics to different destinations for analysis and storage. Think of them as the pipeline that connects your Azure resources to your monitoring tools. For example, you can use them to send the activity logs of a Network Security Group (NSG) to a central Log Analytics workspace for security analysis.
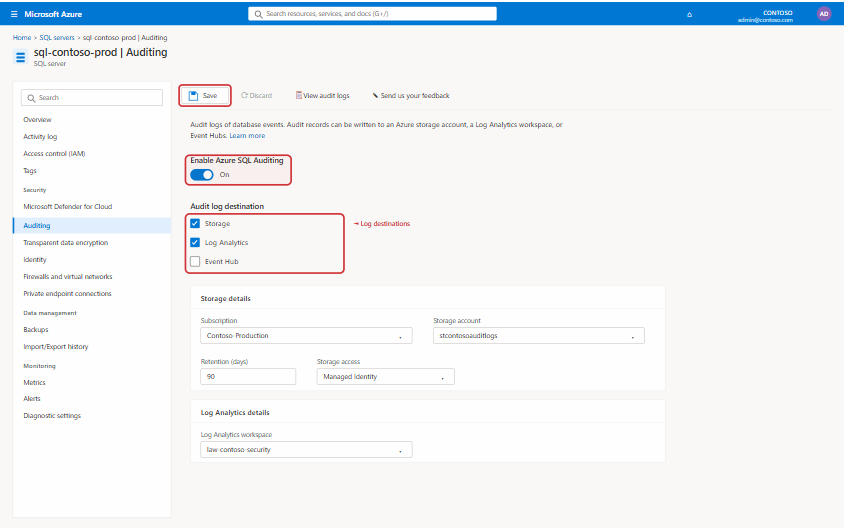
These settings operate on a per-resource basis. Consequently, you must configure a diagnostic setting for each individual resource you want to monitor. This includes everything from virtual machines and storage accounts to Azure Key Vault and Azure SQL databases. Each setting defines which log and metric categories to collect and where to send them.
Destinations for Diagnostic Data
You have three main options for where to send your diagnostic data:
- Log Analytics workspace: This is the most common destination. A Log Analytics workspace is a core component of Azure Monitor Logs. Furthermore, it provides a powerful query language (Kusto Query Language, or KQL) and visualization tools, making it ideal for interactive analysis, dashboarding, and alerting.
- Azure Storage account: Sending logs to a storage account is a cost-effective solution for long-term archival. This is often a requirement for compliance standards that mandate data retention for several years. However, analyzing data directly from storage is less efficient than using a Log Analytics workspace.
- Azure Event Hubs: Event Hubs are a data streaming platform. This destination is perfect for integrating Azure logs with third-party SIEM (Security Information and Event Management) tools like Splunk or QRadar. As a result, your security team can correlate Azure data with logs from other parts of your infrastructure in real-time.
According to Microsoft’s documentation, a single diagnostic setting can send data to any or all of these destinations simultaneously, but you can only have one diagnostic setting per resource.
Why Is Complete Logging Coverage Crucial?
Incomplete logging is a security and operational liability. When an incident occurs—whether it’s a security breach, a performance degradation, or a system outage—the first thing your team needs is data. Without comprehensive logs, you are effectively flying blind. You cannot answer basic questions like “Who accessed this resource?” or “What caused this service to fail?”

For example, imagine a critical virtual machine suddenly becomes unresponsive. Without logs from the VM’s host, the underlying network security group, and the boot diagnostics, your operations team has to guess the cause. This guesswork leads to longer downtime and increased business impact.
Furthermore, many regulatory and compliance frameworks, such as PCI DSS, HIPAA, and GDPR, have strict requirements for log collection and retention. Failing to capture the right logs from all relevant resources can lead to failed audits and significant financial penalties. Complete logging coverage is not just a best practice; it is often a business necessity.
How to Configure Azure Diagnostic Settings
You can configure diagnostic settings through several methods, ranging from manual setup in the Azure portal to fully automated deployments. While the portal is useful for learning or configuring a single resource, it is not a scalable solution for an entire enterprise.
Manual Configuration via the Azure Portal
To configure a setting manually, follow these steps:
- Navigate to the specific Azure resource you want to monitor in the Azure portal.
- In the resource’s menu, under the “Monitoring” section, find and select “Diagnostic settings.”
- Click “+ Add diagnostic setting.”
- Give the setting a name.
- Select the log and metric categories you want to capture. The available categories will vary depending on the resource type.
- Choose the destination(s) for your data (Log Analytics workspace, Storage Account, or Event Hubs) and provide the necessary details.
- Click “Save.”
This process is straightforward but must be repeated for every single resource. For an environment with hundreds or thousands of resources, this manual approach is impractical and prone to human error.
Common Gaps in Logging Coverage
Despite the importance of logging, many organizations struggle to achieve complete coverage. These gaps typically arise from a few common issues. First, there is often a lack of awareness. Teams deploying new resources may not know that they need to configure diagnostic settings separately. They might assume that logging is enabled by default, which is not the case for most resource-specific platform logs.
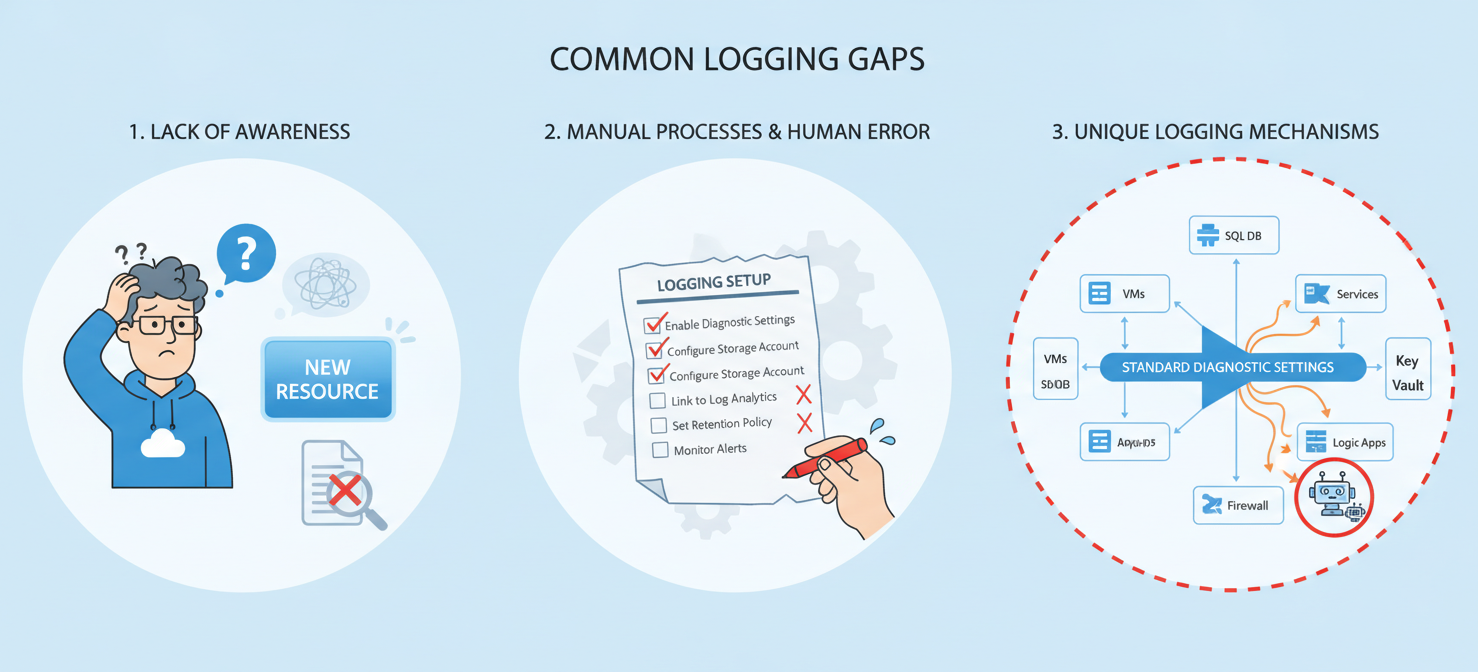
Second, manual configuration processes are unreliable. Even with the best intentions, it is easy to forget to enable logging for a new resource, especially in a dynamic environment where resources are created and deleted frequently. This leads to an inconsistent logging posture where some resources are monitored, and others are not.
Finally, some Azure services have unique logging mechanisms that do not use the standard diagnostic settings interface. For example, Azure Active Directory uses its own reporting and monitoring settings. Understanding these exceptions is crucial for ensuring that you are capturing all relevant data from your entire Azure environment.
Automating and Scaling Your Logging Strategy
The only reliable way to achieve and maintain complete logging coverage is through automation. Azure provides powerful tools to enforce your logging policies across your entire subscription or management group.
Using Azure Policy for Enforcement
Azure Policy is the key to a scalable logging strategy. It allows you to create and assign policies that automatically enforce your rules. For example, you can create a policy that requires all new Azure SQL databases to have a diagnostic setting that sends logs to a specific Log Analytics workspace.
The platform includes several built-in policies for diagnostic settings that you can use out-of-the-box. These policies can audit for resources missing a diagnostic setting or even deploy one automatically if it is missing. By assigning these policies at a high level, such as a management group, you can ensure that all subscriptions and resources underneath inherit your logging standards.
This “policy-as-code” approach has several advantages. It eliminates the risk of human error, ensures consistency, and automatically handles new resources as they are created. Instead of manually configuring each resource, your team can focus on analyzing the data you collect.
Conclusion
Achieving complete logging coverage is not a one-time project but an ongoing discipline. While the concept of Azure Diagnostic Settings is simple, implementing it consistently across a large and dynamic cloud environment presents a significant challenge. Manual configuration is a recipe for failure, leading to inevitable visibility gaps that will only be discovered when you can least afford them. Therefore, the path to comprehensive monitoring lies in automation. By leveraging Azure Policy to enforce your logging standards, you can ensure that every resource is accounted for, providing your security and operations teams with the data they need to protect and manage your environment effectively. In the end, you can’t analyze the logs you never collected.
To truly master your Azure observability and move beyond manual configuration, you can easily start a free trial of our solution or book a personalized demo to see how automation can ensure complete logging coverage.
 7-day free trial