As a FinOps lead, you are responsible for translating cloud cost data into business value. Your team lives and breathes cost allocation, showback/chargeback, and the endless quest for accurate attribution. The sheer volume of Azure service and pricing permutations can make this a formidable challenge. Therefore, selecting the right tooling is not just an IT decision; it’s a core business strategy. This article provides a cloud financial management quadrant framework to help you evaluate and select the best tools for managing your Azure spend, focusing on the metrics and outcomes that matter to your role.
Key takeaways:
- Native Azure tools provide a solid, no-cost foundation, but often require significant effort to scale for complex chargeback and showback models.
- Third-party platforms excel at multi-cloud visibility, automation, and providing granular, business-centric reporting dashboards.
- A successful implementation follows a 4-step phased approach: assess, pilot, integrate, and automate.
- Choosing the right tool depends on your organization’s maturity in tagging strategy, stakeholder reporting needs, and multi-cloud footprint.
What is a Cloud Financial Management Quadrant?
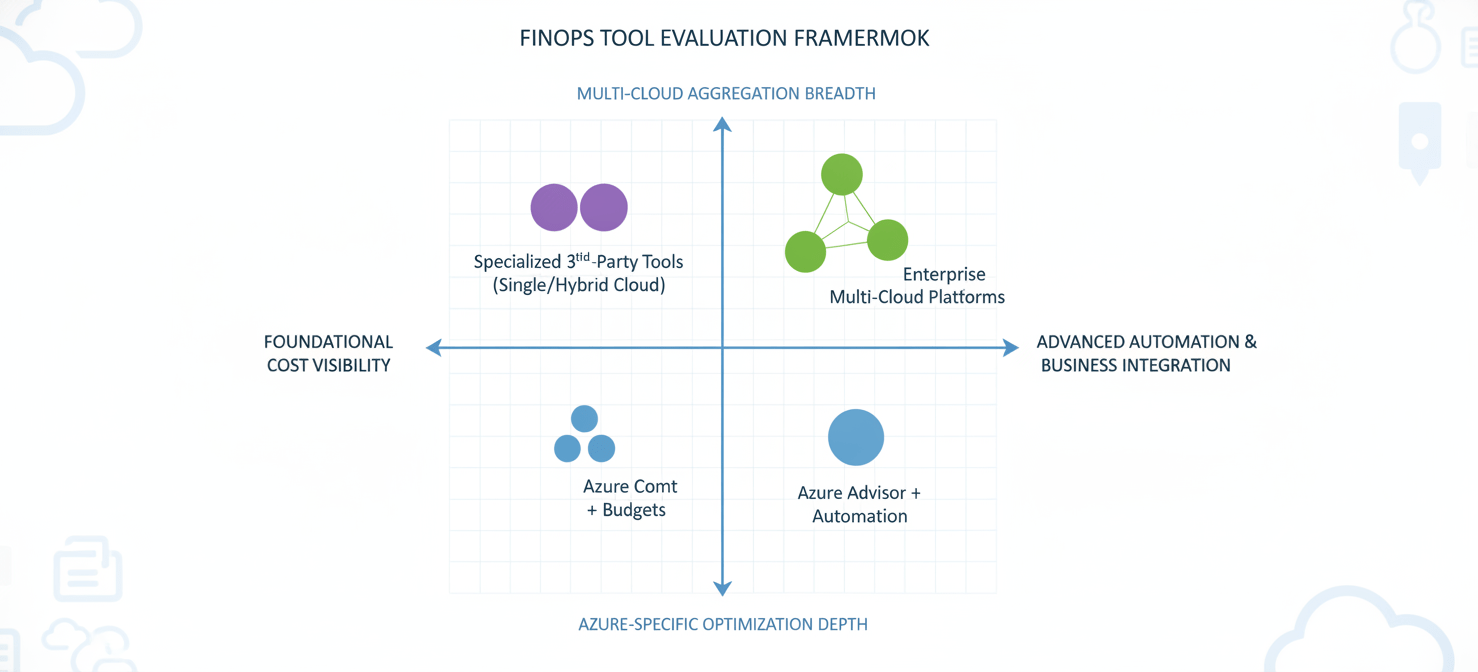
Think of the cloud financial management quadrant as a mental model for categorizing and evaluating FinOps tools for Azure. It helps you move beyond a simple list of features to a more strategic assessment of which solution fits your operational reality. Instead of a literal four-box graphic, this framework helps you plot tools based on key axes that matter to a cost analyst: depth of Azure-specific optimization versus breadth of multi-cloud aggregation, and foundational cost visibility versus advanced automation and business integration.
For your team, the goal is to find a tool that directly supports your primary KPIs. These often include improving cost attribution accuracy, reducing untagged or unallocated spend, and increasing the efficiency of your showback or chargeback processes. A tool might be strong in one area, like deep container cost analysis, but weaker in another, such as integrating with your on-premises financial systems.
Therefore, the quadrant isn’t about finding a single “best” tool. It’s about understanding the trade-offs. One axis might represent the spectrum from raw data analysis to automated rightsizing recommendations. Another could represent the journey from basic cost reporting to predictive forecasting and anomaly detection. By mapping potential tools against these spectra, you can identify which solution best aligns with your current FinOps maturity and your strategic goals for cost governance.
Native Azure Tools: The Foundation of Your FinOps Practice
Before looking at third-party options, it is essential to maximize the capabilities of the tools already at your disposal within the Azure ecosystem. These native tools are the bedrock of any Azure-focused FinOps practice, offering robust data at no additional licensing cost.
Microsoft Cost Management
Microsoft Cost Management, available directly in the Azure portal, is your starting point. It provides comprehensive visibility into where your Azure and AWS (through a connector) costs are accumulating. For a FinOps lead, its core strengths lie in cost analysis, budget creation, and setting up alerts. You can group and filter costs by a wide range of properties, including tags, resource groups, and subscription, which is fundamental for initial cost allocation.
However, its primary limitation is that it operates on raw cloud billing data. Creating sophisticated, business-led showback reports that translate this data into departmental charges often requires exporting the data and manipulating it externally. While you can create budgets and alerts, the automation capabilities for taking action based on those alerts are less advanced than what specialized platforms offer.
Azure Advisor
Azure Advisor acts as a personalized cloud consultant, providing recommendations to optimize your Azure deployments. For your team, the most critical recommendations fall under the “Cost” category. Advisor will identify idle virtual machines, recommend reserved instance purchases, and suggest rightsizing opportunities for underutilized resources. Microsoft’s documentation highlights that these recommendations can lead to significant savings.
The value of Advisor is in its direct, actionable intelligence. Instead of just seeing a high virtual machine cost, you get a specific recommendation to resize or shut it down. The challenge, however, is operationalizing these recommendations at scale. In a large enterprise, manually acting on hundreds of Advisor recommendations is not feasible. This is often a key driver for seeking third-party tools that can automate the implementation of these suggestions.
Third-Party Platforms: Specialists and Aggregators
While native tools provide the essential data, third-party cloud financial management platforms are designed to translate that data into business context and automate optimization. These tools are built specifically for the FinOps professional, with features that directly address the complexities of cost allocation, chargeback, and stakeholder reporting in large, dynamic environments.
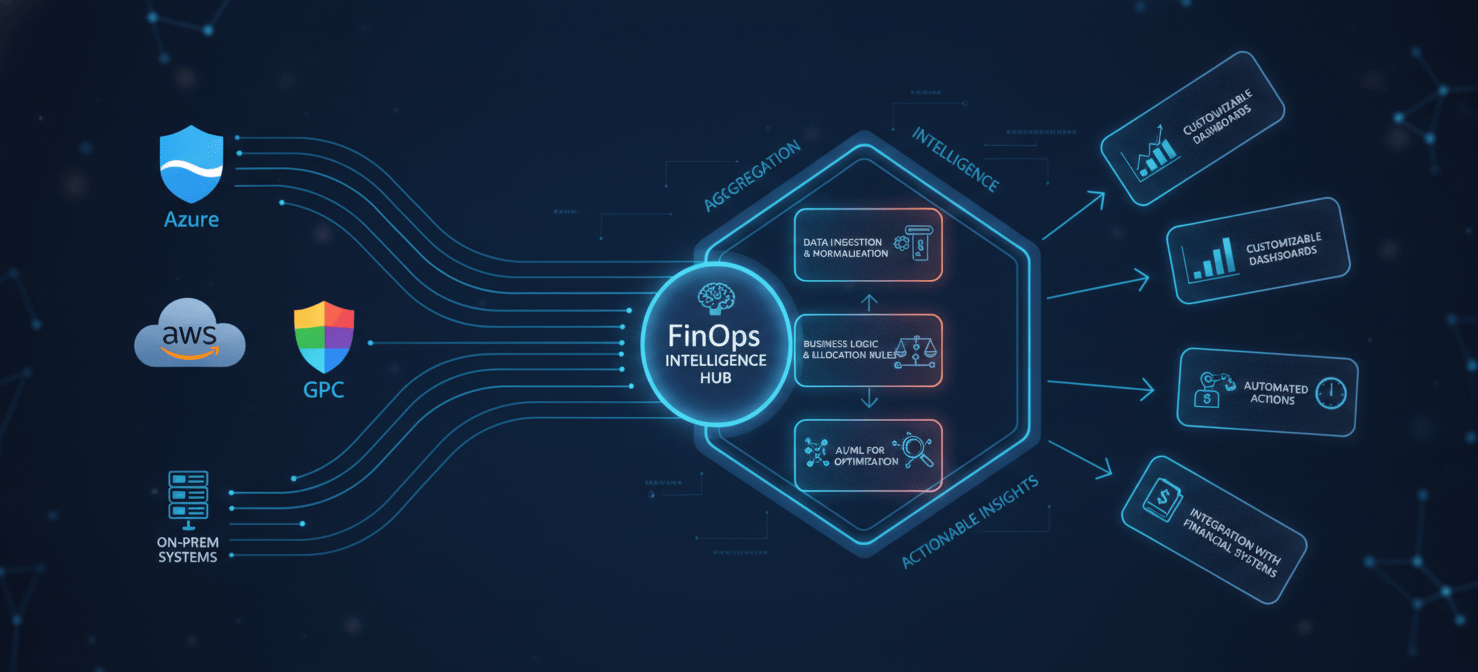
These platforms typically connect to your Azure billing and resource APIs to ingest vast amounts of data. Their value proposition is turning that raw data into curated, actionable insights. They often provide more sophisticated and customizable dashboards than native tools, allowing you to build reports that resonate with finance, engineering, and executive teams.
Enhanced Cost Allocation and Chargeback
One of the primary reasons FinOps teams turn to third-party tools is for more advanced cost allocation capabilities. While Azure’s tagging is powerful, these platforms add layers of business rules and logic on top. For example, you can create rules to allocate shared infrastructure costs (like networking or shared Kubernetes clusters) based on consumption metrics. This allows for a much fairer and more accurate chargeback or showback model.
Furthermore, these tools can often ingest business metadata from other systems, like a CMDB or an application directory. This enriches the cost data, allowing you to attribute spend not just to a resource tag, but to a specific cost center, application owner, or product line. This level of detail is crucial for making data-driven decisions about resource allocation and application ROI.
Automation and Anomaly Detection
Another key differentiator is automation. Many platforms can be configured to automatically act on optimization recommendations. For instance, they can execute VM rightsizing, terminate idle resources based on predefined policies, or even automate the purchasing and management of Reserved Instances and Savings Plans to maximize discounts.
In addition, their anomaly detection algorithms are often more advanced than native alerts. They can learn your typical spending patterns and flag deviations that might indicate a billing error, a resource leak, or unexpected scaling behavior. This proactive alerting can save you from significant budget overruns, turning your team from a reactive cost reporter into a proactive cost manager.
How to Choose the Right Tool for Your Organization
Selecting the right FinOps tool for Azure requires a structured evaluation process that goes beyond a simple feature comparison. The best choice for your organization will depend on your specific needs, maturity level, and the complexity of your cloud environment.
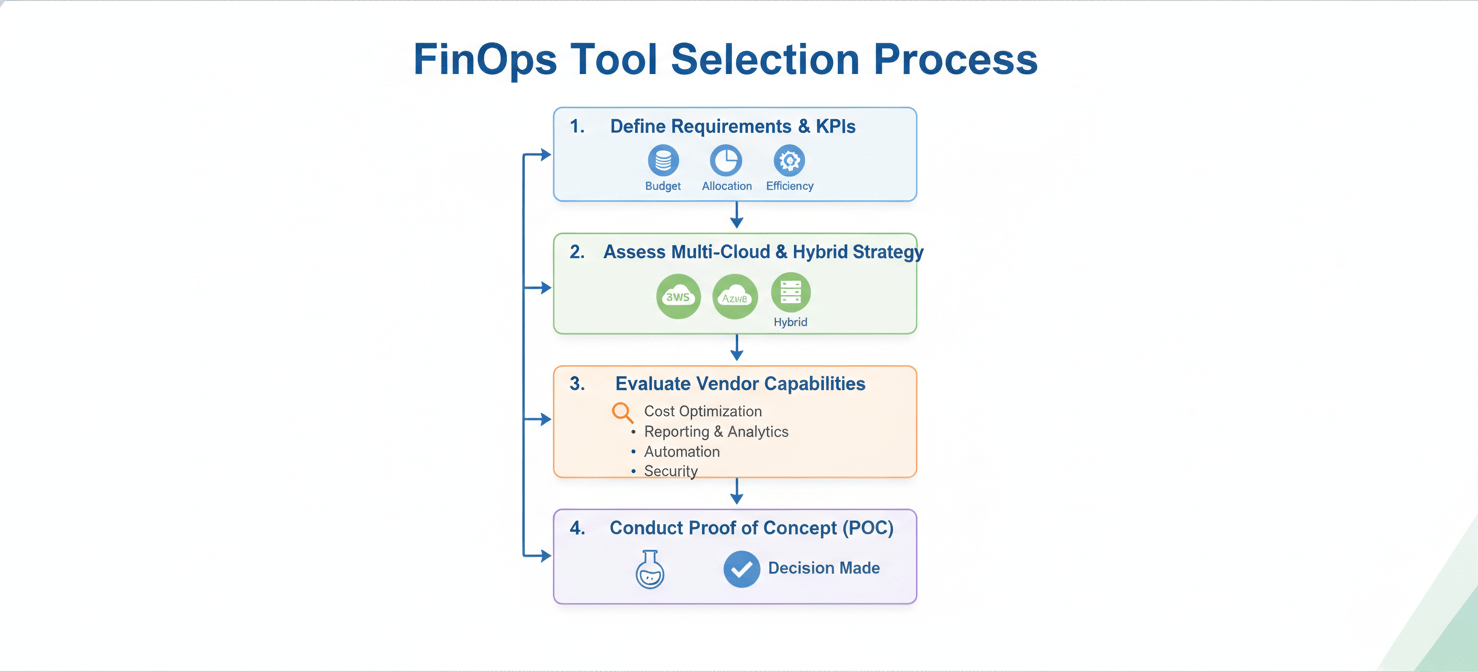
First, you must clearly define your requirements. Are you primarily struggling with accurate cost allocation for showback? Or is your main pain point the manual effort required to act on rightsizing recommendations? Document your top three to five challenges and use them as your evaluation criteria. For example, if untagged resources are a major issue, a tool’s ability to identify and help remediate them should be a key consideration.
Next, consider your organization’s multi-cloud and hybrid strategy. If you are a 100% Azure shop, a tool with deep Azure-specific integrations might be the best fit. However, if you have a significant footprint in AWS or GCP, or if you need to incorporate on-premises costs, a multi-cloud platform that can provide a single, aggregated view of all your IT spending will be far more valuable. Gartner’s research often emphasizes the importance of a unified view for effective cloud governance.
Finally, conduct a proof of concept (POC) with your top two or three candidates. A POC allows you to test the tool with your own data and in your own environment. During the POC, focus on a specific use case, such as building a chargeback report for a particular business unit or identifying optimization opportunities for a key application. This hands-on evaluation will reveal how intuitive the platform is, how well it integrates with your existing systems, and the quality of support you can expect from the vendor.
Implementing Your Chosen Solution: A Phased Approach
Deploying a new cloud financial management platform is not a one-time event; it’s a process that requires careful planning and phased execution. A successful implementation ensures that the tool is not only technically integrated but also adopted by the teams who will use it to make decisions.
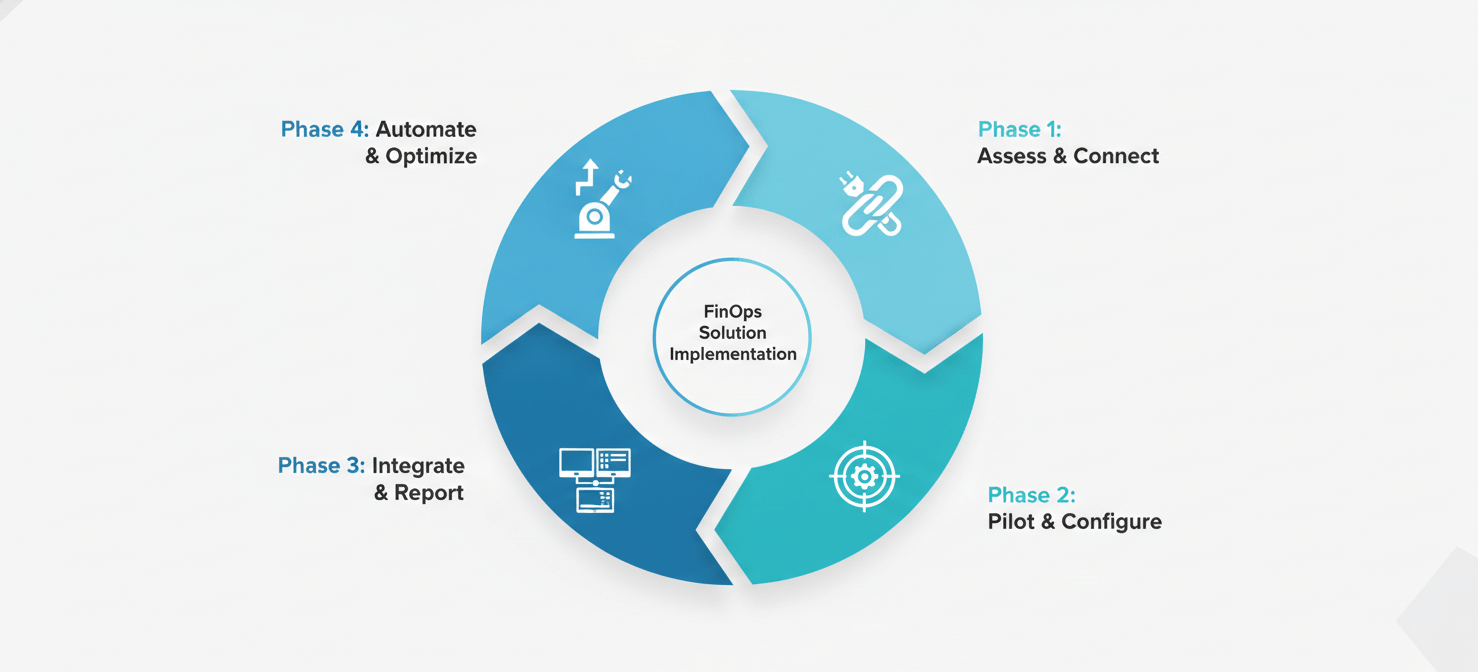
Phase 1: Assess and Connect
The first step is to connect the tool to your Azure environment and begin ingesting data. This initial phase is about establishing a baseline. You will work with the vendor to set up the necessary service principals and permissions, allowing the platform to access your billing and resource data. During this phase, your primary goal is to validate that the data presented in the new tool reconciles with what you see in Microsoft Cost Management. This builds trust in the platform’s accuracy.
Phase 2: Pilot and Configure
Next, select a specific business unit or application team for a pilot program. Do not attempt a full-scale, enterprise-wide rollout from day one. Work with this pilot group to configure the dashboards, reports, and allocation rules that are most relevant to them. This allows you to refine your processes in a controlled environment. For example, you might work with the pilot team to improve their tagging hygiene or to build their first showback report. This phase is crucial for gathering feedback and creating internal champions for the new tool.
Phase 3: Integrate and Report
Once the pilot is successful, you can begin to expand the rollout to other teams. This phase often involves integrating the FinOps platform with other business systems. For instance, you might integrate it with your ITSM tool (like ServiceNow) to automate the approval process for optimization changes, or with your financial software to streamline the chargeback process. You will also begin to standardize your reporting, creating a set of core dashboards and KPIs that will be used across the organization.
Phase 4: Automate and Optimize
The final phase is about moving from visibility to action. With the data, reporting, and integrations in place, you can start to leverage the platform’s automation capabilities. This might involve setting up automated policies to terminate non-compliant resources, automatically purchasing reserved instances based on usage patterns, or creating closed-loop workflows for rightsizing recommendations. This is the stage where you fully realize the ROI of your investment, transforming your FinOps practice from a reporting function to a driver of efficiency and value.
Conclusion
Ultimately, navigating the cloud financial management quadrant for Azure tools is about finding the right balance for your organization’s specific needs. Native Azure tools provide a powerful and free foundation for cost visibility, but they often require significant manual effort to produce the business-centric insights needed for effective showback and chargeback. Third-party platforms fill this gap, offering sophisticated allocation, automation, and multi-cloud capabilities that can mature your FinOps practice. The right choice is not about native versus third-party; it’s about understanding where the native capabilities end and where the specialized features of a dedicated platform begin to deliver a clear return on investment. Your goal is not to buy a dashboard, but to acquire a capability that embeds cost-consciousness into your engineering culture and provides finance with the predictable, transparent data it requires. Choose wisely, and you’ll spend less time wrangling spreadsheets and more time driving strategic value.
If you’re ready to move beyond basic reporting and embed true cost-consciousness into your operations, you can easily start your journey with a free Binadox trial or book a personalized demo to explore how a dedicated platform can transform your FinOps practice.