



Getting your EC2 instance sizes right is a balancing act. Overprovision, and you’re wasting money on idle capacity. Underprovision, and your applications suffer from poor performance. The key to finding that sweet spot is data-driven analysis, and for that, you need to focus on the right metrics. This article explores the essential cloudwatch metrics for ec2 rightsizing, helping you move from guesswork to a confident, data-backed optimization strategy. By understanding which EC2 performance metrics to track, you can make informed decisions that lower costs without compromising performance.
Key takeaways
- Memory utilization is not a standard EC2 metric; you must install the CloudWatch agent to collect it.
- For a reliable analysis, you should gather metrics over a period of at least 14 days to identify meaningful usage patterns.
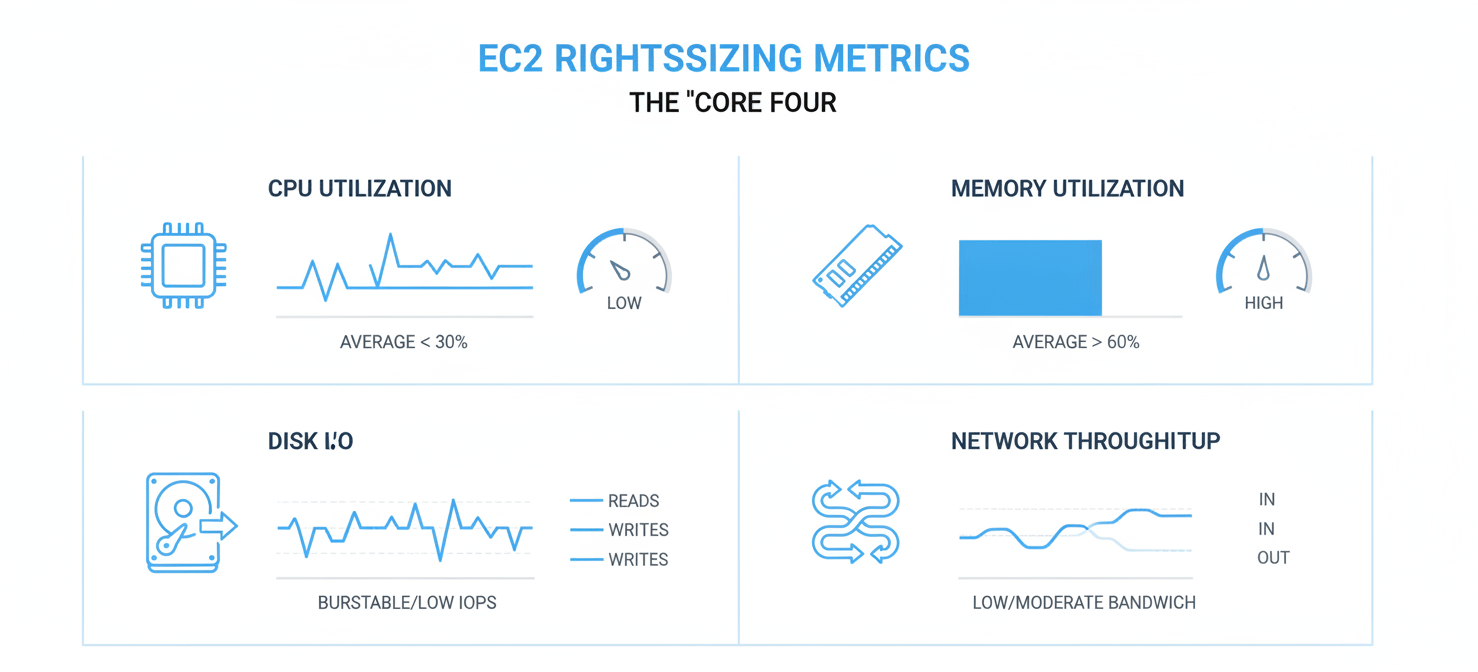
- The four core metrics for rightsizing are CPU, memory, disk I/O, and network throughput.
- Tools like AWS Compute Optimizer can automate the analysis of these metrics to provide actionable rightsizing recommendations.
Why Standard CloudWatch Metrics Aren’t Enough
By default, every EC2 instance sends several key metrics to Amazon CloudWatch, such as CPUUtilization, NetworkIn, NetworkOut, and various disk read/write operations. While these are a great starting point, they paint an incomplete picture for rightsizing. The most significant omission is memory utilization.
The hypervisor that manages EC2 instances can see CPU load, network traffic, and disk activity from the outside. However, it has no visibility into the guest operating system’s memory management. Without knowing how much RAM your applications are actually using versus how much is allocated, you are essentially flying blind. Making a rightsizing decision without memory data often leads to one of two bad outcomes:
- You downsize an instance that has low CPU usage but high memory pressure, causing performance degradation or application crashes.
- You conservatively avoid downsizing an instance because you’re unsure of its memory needs, leaving potential savings on the table.
To get a complete view, you must collect OS-level metrics. This is accomplished by installing the unified CloudWatch Agent on your EC2 instances. The agent can collect detailed system-level metrics, including memory usage, and send them to CloudWatch as custom metrics, providing the critical data needed for a thorough AWS rightsizing analysis.
Core Four: The Essential CloudWatch Metrics for EC2 Rightsizing
Once you have the CloudWatch agent deployed, you can focus on the four pillars of instance performance. A proper rightsizing analysis requires a holistic view of these core metrics to ensure you’re matching instance capabilities to workload demands.
CPU Utilization
The CPUUtilization metric is the percentage of allocated compute units currently in use. This is often the first metric teams look at, but it requires careful interpretation.
- Sustained Low Utilization: An instance with a maximum CPU utilization that consistently stays below 40% over several weeks is a prime candidate for downsizing. For example, moving from a
c5.4xlargeto ac5.2xlargecould cut costs in half without risk. - Sustained High Utilization: Instances running consistently above 80-90% are at risk of performance throttling and may need to be upsized.
- Spiky or Burstable Workloads: Look at the maximum utilization, not just the average. An instance might have a low average CPU but experience critical peaks. For these workloads, consider burstable instance types (like the T-family) or ensure the chosen instance size can handle the peaks without issue.
Memory Utilization
As mentioned, this metric, typically named mem_used_percent or similar, is only available via the CloudWatch Agent. It is arguably the most critical metric for rightsizing.
- Look for Pressure: High memory utilization (consistently over 80%) is a strong indicator that an instance should not be downsized, even if its CPU is low. It might even be a candidate for a memory-optimized instance family (like the R-family).
- Avoid Oversizing: Like CPU, if an instance’s memory usage rarely exceeds 40%, it is likely overprovisioned. You can safely select an instance type with less RAM.
Disk I/O
For workloads that are storage-intensive, disk metrics are crucial. The key metrics are DiskReadOps, DiskWriteOps, DiskReadBytes, and DiskWriteBytes, which track the I/O operations per second (IOPS) and throughput for instance store volumes. For EBS-backed instances, you’ll also want to monitor the equivalent EBS metrics.
- IOPS and Throughput Limits: Every EC2 instance type has a maximum EBS throughput and IOPS it can support. If your workload consistently hits these limits, you may need to switch to an instance type with better EBS optimization or provision volumes with higher IOPS.
- Underutilized Disks: Conversely, if disk I/O is consistently low, you can avoid paying for high-performance, storage-optimized instances.
Network Throughput
Network performance can be a hidden bottleneck. The primary metrics are NetworkIn and NetworkOut, which measure the bytes transferred in and out of the instance.
- Baseline vs. Burstable Performance: Many instance types have a baseline network performance and the ability to burst for short periods. If your application requires sustained high network throughput, ensure you choose an instance that can support it without relying on burst credits.
- Network-Intensive Applications: For applications like load balancers, firewalls, or data transfer nodes, network metrics may be more important than CPU or memory. Analyze
NetworkInandNetworkOutto ensure the instance is not a bottleneck.
Beyond the Core: Advanced Metrics for Granular Analysis
For more complex workloads, you may need to look beyond the core four metrics. These advanced EC2 performance metrics can help you fine-tune your instance selection for specific use cases.
For example, Auto Scaling groups have their own set of CloudWatch metrics, such as GroupInServiceInstances and GroupDesiredCapacity, which can provide context for the behavior of individual instances within the group. For network-intensive applications running on Nitro-based instances, AWS provides additional metrics like linklocal_allowance_exceeded that can reveal when traffic is being dropped due to exceeding network allowances.
Furthermore, for applications with specific I/O patterns, analyzing disk queue depth can reveal if the storage is keeping up with the application’s demands. By digging into these more granular metrics, your team can move from general rightsizing to precise performance tuning, ensuring that every component of your infrastructure is optimized.
Putting It All Together: A Practical Rightsizing Workflow
Having the right data is only half the battle. You need a systematic process to turn that data into action.
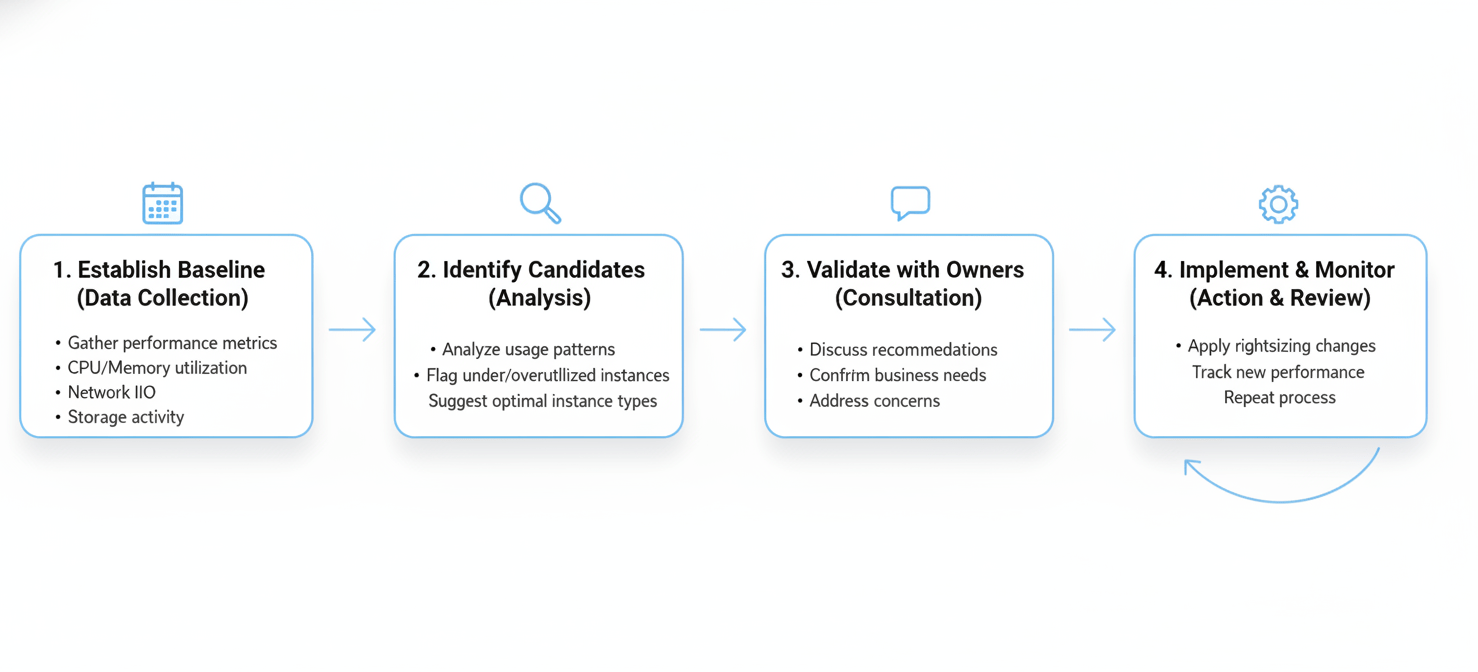
- Establish a Baseline: First, collect data for a meaningful period. A minimum of 14 days is recommended, but 30-90 days is even better to capture monthly or quarterly business cycles.
- Identify Candidates: Next, analyze the collected metrics to find over-provisioned and under-provisioned instances. Focus on instances with average CPU and memory utilization below 40% for downsizing and those with sustained high utilization for upsizing.
- Validate with Application Owners: Before making any changes, it’s crucial to consult with the teams who own the applications. Metrics alone don’t show the full picture; an instance might be idle now in preparation for a critical batch job that runs once a week.
- Implement and Monitor: Once a change is approved, implement it during a maintenance window. After resizing, closely monitor the instance’s performance metrics to ensure the change has had the desired effect without introducing new problems.
Tools to Automate Your AWS Rightsizing Analysis
Manually analyzing metrics across hundreds or thousands of instances is impractical. Fortunately, several tools can help automate the process.
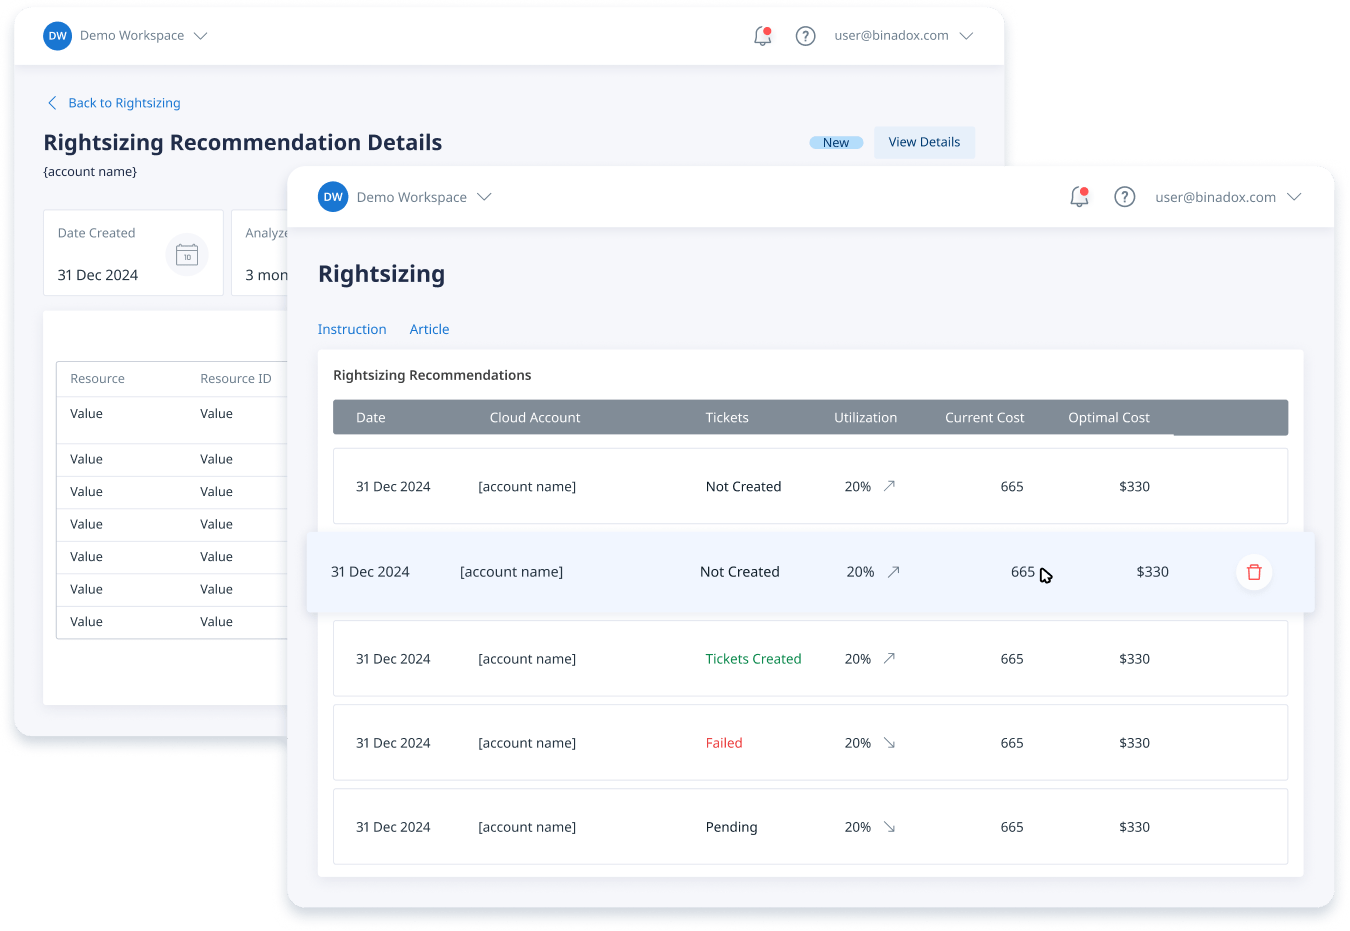
AWS Compute Optimizer is a native AWS service that analyzes CloudWatch metrics for your resources and provides data-driven rightsizing recommendations. It uses machine learning to identify patterns over time and can even provide recommendations for migrating to newer, more cost-effective instance generations, including Graviton processors. For the best results, you must enable memory metric collection with the CloudWatch agent, as Compute Optimizer will incorporate this data to provide more accurate recommendations.
In addition to Compute Optimizer, AWS Cost Explorer provides rightsizing recommendations that can help you identify low-hanging fruit for cost savings. These tools simplify the AWS rightsizing analysis by doing the heavy lifting of data collection and pattern recognition, allowing your team to focus on validating and implementing the suggested changes.
Conclusion
Choosing the right instance size is fundamental to controlling costs and ensuring performance in AWS. Relying on default metrics alone leaves a critical gap in your analysis. By deploying the CloudWatch agent and focusing on the core four metrics—CPU, memory, disk, and network—you can build a complete performance profile for each workload. This data-driven approach removes the guesswork from instance selection. Ultimately, a successful optimization strategy depends on using the right cloudwatch metrics for ec2 rightsizing to make informed, confident decisions. It’s less about crystal balls and more about good data hygiene.
To transition from guesswork to confident, data-backed EC2 rightsizing, you can set up your free Binadox account to begin applying these insights, or for a tailored exploration of how our platform can streamline your optimization, we invite you to book a demo with our specialists.
 7-day free trial