



An unexpected spike in your AWS bill can be a frustrating experience, especially when the source is a service as foundational as CloudWatch. Because CloudWatch aggregates data from many other services, its costs can escalate quickly and obscure the root cause. This is where a dedicated tool for AWS cost analysis becomes essential. By using a cost explorer, you can dissect your CloudWatch charges, identify the specific drivers behind the increase, and take targeted action to bring your spending back under control.
Key takeaways
- AWS Cost Explorer can visualize your CloudWatch spending over the last 12 months, filtered by service, usage type, and region.
- The primary drivers of CloudWatch costs are typically log ingestion, custom metrics, and API requests.
- You can pinpoint the exact source of a cost spike by grouping your CloudWatch bill by “Usage Type” within the Cost Explorer interface.
- Setting up AWS Budgets and alarms can provide early warnings before CloudWatch costs escalate significantly.
Understanding the “Why” Behind CloudWatch Costs
Before diving into cost analysis, it’s important to understand how CloudWatch generates charges. It’s not a single line item but a collection of usage-based fees across several features. Often, teams are surprised when costs rise because other AWS services they’ve deployed automatically leverage CloudWatch for logging and metrics.
The main components that contribute to your bill are:
- Metrics: You pay for the number of custom metrics you store per month. While standard metrics from many AWS services are free, detailed monitoring and custom application metrics are not. The first 10,000 metrics, for instance, have a specific per-metric monthly cost.
- Logs: Costs for logs are driven by the volume of data ingested (per GB) and how long you store it. By default, logs are stored indefinitely, which can lead to steadily increasing costs if a retention policy isn’t set.
- API Requests: You are charged for API calls like
GetMetricDataandPutMetricData. These requests can add up quickly, especially with high-frequency monitoring or third-party tool integrations. - Alarms: Alarms are priced based on their resolution. A high-resolution alarm that evaluates a metric every 10 seconds will cost more than a standard one-minute alarm.
- Other Features: Services like Dashboards, Synthetics Canary runs, and Contributor Insights all have their own pricing dimensions that contribute to the total CloudWatch bill.
Step-by-Step Guide to Using a Cost Explorer
Accessing and Filtering for CloudWatch
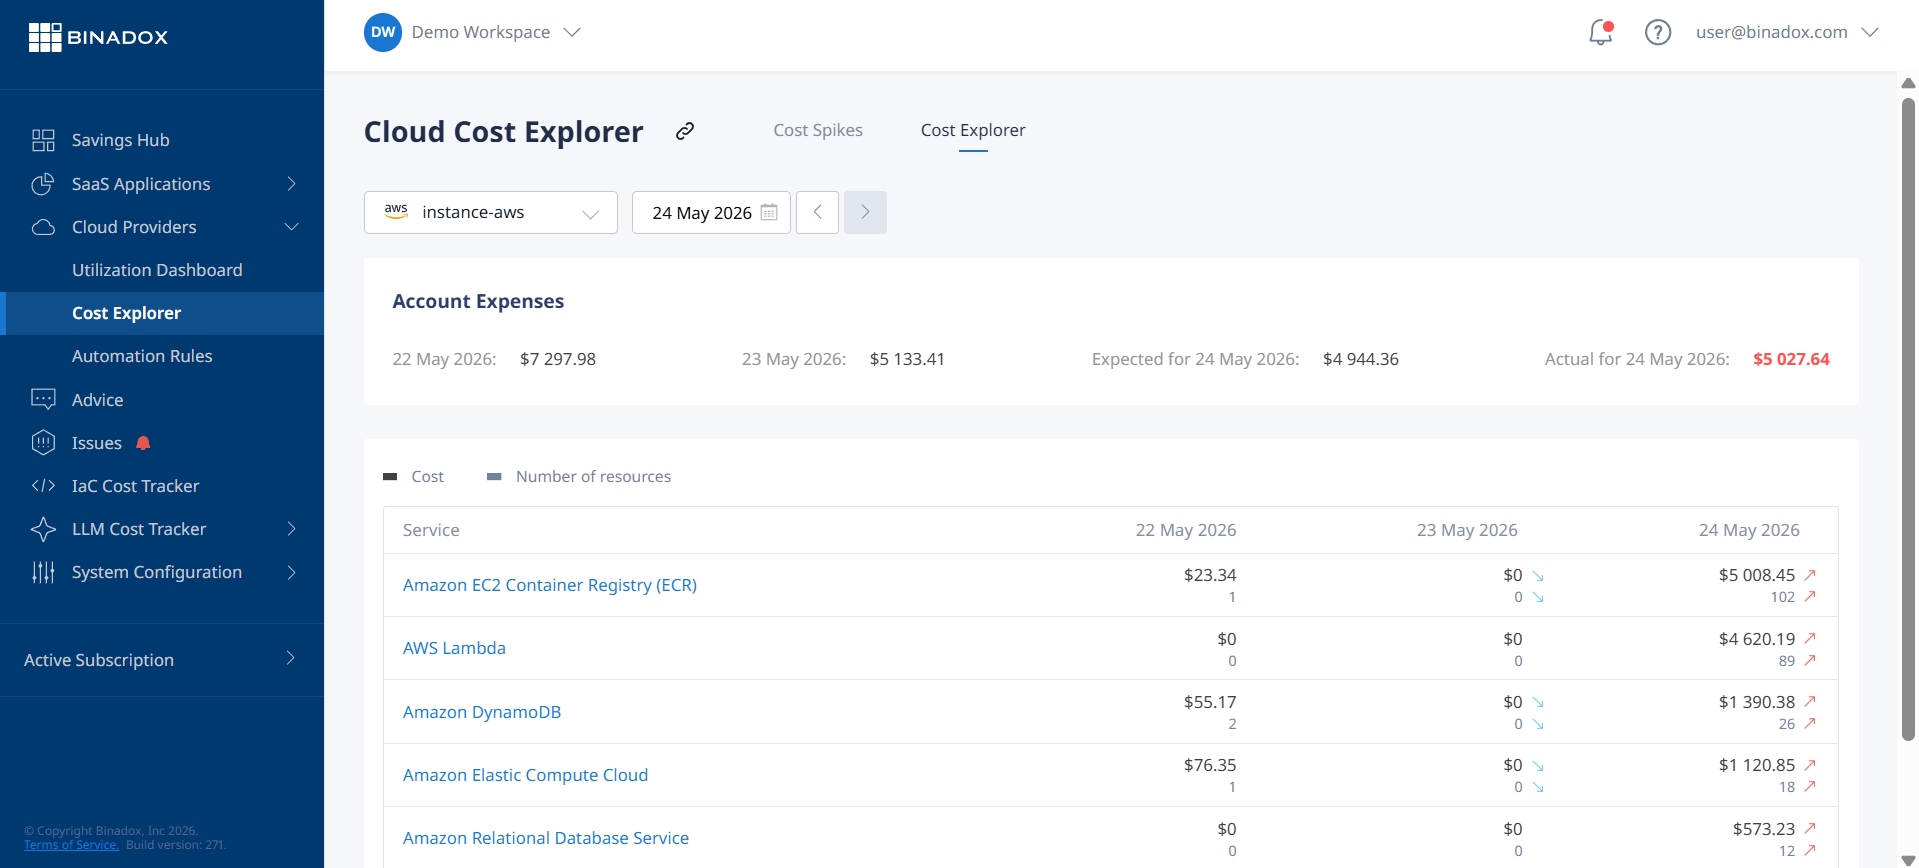
First, you need to navigate to the Cost Explorer service within the AWS Management Console. Once there, you’ll see a dashboard showing your overall spending. To isolate CloudWatch costs, use the filtering options on the right-hand side of the interface.
- In the “Filters” section, select “Service.”
- Choose “CloudWatch” from the list. This will update the main graph to show only CloudWatch-related spending over your selected time period.
This initial view gives you a high-level trend of your CloudWatch costs. You can adjust the time range to view data for the last few months to see when a spike began.
Grouping Data to Find the Root Cause
The real power of a cost explorer comes from its ability to group data by different dimensions. To find the source of a billing spike, the most effective dimension is “Usage Type.”
- Above the main chart, find the “Group by” dropdown menu.
- Select “Usage Type.”
The chart and the table below it will now break down your CloudWatch costs by the specific service components that generated them. You will see line items corresponding to different API operations, data ingestion, and metric storage. For example, a usage type like EU-CW:GMD-Metrics represents costs from bulk API requests in a specific region. By examining this CloudWatch cost breakdown, you can quickly see if the spike was caused by excessive logging, a large number of new custom metrics, or frequent API calls.
Analyzing Common Culprits in Bill Spikes
After using the cost explorer to group your data, you’ll likely find the cost increase is concentrated in one or two areas. Here are some common culprits and how to address them.
Excessive Logging
High log ingestion volumes are a frequent cause of unexpected costs. This can happen if an application’s log verbosity is set too high (e.g., to DEBUG level in a production environment) or if a new feature is generating an unexpectedly high number of log events.
Once you’ve identified DataProcessing-Bytes or a similar usage type as the cause, you can use CloudWatch Logs Insights to run queries and identify which specific log groups are contributing the most data. From there, you can implement shorter retention policies or adjust the application’s logging level.
Proliferation of Custom Metrics
Another common issue is the creation of too many custom metrics. Every unique combination of a metric name and its dimensions is treated as a separate metric, each incurring a monthly fee. For example, if you’re monitoring a fleet of servers and include the instance ID as a dimension, you could be creating thousands of metrics without realizing it. A review of your team’s monitoring strategy might be necessary to consolidate metrics or be more selective about what is tracked.
High-Frequency Alarms and API Calls
High-resolution alarms and frequent GetMetricData API calls can also drive up costs. If you have alarms checking metrics every 10 seconds, consider whether a standard 60-second interval would suffice. Similarly, analyze which tools or scripts are making API calls. You may be able to optimize them to fetch data in larger batches or less frequently.
Proactive Cost Management and Prevention
Investigating a cost spike after the fact is useful, but preventing one in the first place is better. AWS provides tools to help you stay ahead of your spending.
Setting Up AWS Budgets
You can create a budget specifically for your CloudWatch service costs. AWS Budgets allows you to set a custom spending threshold and receive alerts via email or SNS when your actual or forecasted spending exceeds that amount. This provides an early warning system, allowing you to investigate with a cost explorer before the billing cycle ends.
Regular Cost Reviews
Make AWS cost analysis a regular part of your team’s operational reviews. By dedicating time each month or quarter to look through Cost Explorer reports, you can spot upward trends before they become major problems. This practice helps build a culture of cost awareness and accountability within your engineering teams.
Conclusion
When your CloudWatch bill suddenly skyrockets, the situation can feel opaque and difficult to diagnose. However, by leveraging a tool like AWS cost explorer, you can systematically dissect the charges and uncover the precise drivers. Filtering by the CloudWatch service and grouping by usage type transforms a confusing bill into a clear action plan. Whether the culprit is verbose logging, an excess of custom metrics, or overactive alarms, the data will point you in the right direction. Ultimately, a cost explorer is not just a reactive tool for solving billing mysteries; it’s a proactive instrument for maintaining financial health in the cloud. Don’t just pay the bill—understand it.
For a clearer path to understanding and optimizing your cloud spend, consider how Binadox can empower your team; you can easily find a convenient time to connect with our experts or access your free Binadox trial to see it in action.
 7-day free trial