



As a FinOps lead or cost analyst, you know that engineering freedom can quickly become a balance sheet problem. Kubernetes on Azure (AKS) is a powerful platform for innovation, but its dynamic and abstracted nature often obscures the true cost of running applications. Effective kubernetes cost management isn’t just about finding savings; it’s about providing the visibility and data needed for engineering teams to make cost-conscious decisions without slowing down. This guide reframes Kubernetes cost management on Azure around the metrics, dashboards, and allocation models that matter to your role.
Key takeaways
- Visibility First: You can’t manage what you can’t see. Implementing namespace-level cost visibility with tools like Azure Cost Management’s AKS cost analysis feature is the foundational first step.
- Right-Sizing is Key: Over-provisioning is the single largest driver of waste. Studies show that teams can reduce Kubernetes compute costs by 30-50% by aligning resource requests with actual usage.
- Automate for Efficiency: Leverage Azure’s built-in automation like the Cluster Autoscaler and Horizontal Pod Autoscaler to dynamically match capacity to demand, eliminating payment for idle resources.
- Embrace Showback: Before implementing a full chargeback model, start with showback to build awareness. Providing teams with clear reports on their resource consumption fosters a culture of cost accountability.
The Challenge: Why Kubernetes Costs Spiral on Azure
The primary challenge with FinOps for Kubernetes on Azure is the layer of abstraction. Your Azure bill shows costs for virtual machines, disks, and load balancers, but it doesn’t tell you which specific microservice, team, or project is driving that consumption. The costs are aggregated at the infrastructure level (the node pools), not at the workload level where business value is created.

This leads to several critical problems for a cost analyst:
- Lack of Granular Attribution: It’s nearly impossible to accurately allocate costs from a shared AKS cluster back to the individual teams or products using it. This makes chargeback or even showback initiatives difficult to implement fairly.
- Pervasive Over-provisioning: Developers, incentivized to ensure application performance, often set resource requests and limits far higher than necessary. This “headroom insurance” results in significant waste as you pay for reserved-but-unused capacity on your VM nodes.
- Hidden Idle Resources: Clusters often have idle or “zombie” resources—unclaimed persistent volumes, oversized node pools, or forgotten test deployments—that accrue costs without providing any value.
- Complex Pricing Models: The total cost of AKS is a sum of multiple parts: the cluster management fee for Standard or Premium tiers, the worker node VMs, persistent storage, load balancers, and network egress traffic. Without a clear understanding of these components, forecasting and budgeting become unreliable.
Step 1: Gaining Visibility into Your AKS Costs
The first principle of any successful FinOps practice is visibility. Before you can optimize, you must be able to measure and attribute costs accurately. Your primary goal is to translate raw Azure infrastructure costs into meaningful business metrics.
Implementing Namespace-Level Cost Allocation
Namespaces are the logical unit for cost allocation in a multi-tenant Kubernetes cluster. By assigning each team, project, or application to its own namespace, you can begin to track its specific resource consumption.
Your main tool here is the AKS cost analysis add-on for Azure Cost Management. This feature integrates OpenCost to break down cluster expenses and display them by Kubernetes constructs like namespace and cluster. Once enabled, you can navigate to your subscription’s Cost Analysis view in the Azure portal and select the “Kubernetes namespaces” view to see a detailed breakdown. This provides the data needed to build your initial showback dashboards.
Establishing a Tagging and Labeling Strategy
While the cost analysis add-on is powerful, a robust tagging strategy is essential for comprehensive azure cloud cost management. Kubernetes labels are key-value pairs attached to resources like pods and namespaces. These labels can be used to denote the owning team, cost center, application ID, or environment.
Work with your platform engineering team to enforce a mandatory labeling policy for all new deployments. This can be automated using policy-as-code tools like Gatekeeper. These labels will allow you to filter and group costs in your analysis tools, providing another layer of granularity for your chargeback and showback reports.
Step 2: Implementing Effective Kubernetes Cost Management and Allocation
With visibility established, the next step is to implement governance models that drive accountability. This is where you translate raw cost data into actionable insights for engineering teams through showback and, eventually, chargeback.
From Showback to Chargeback
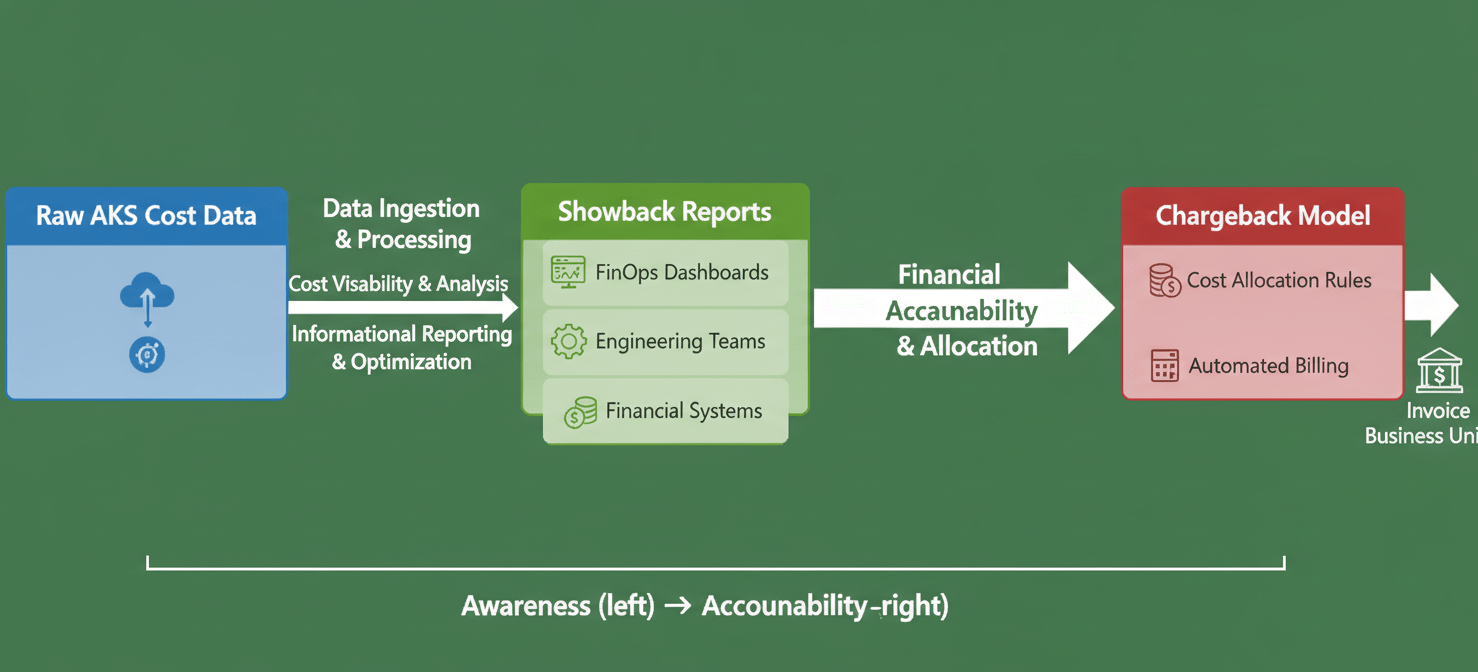
A showback model involves reporting resource consumption costs back to the teams that incurred them, without actually billing their department. The goal is to raise awareness and encourage self-optimization. Start by creating simple dashboards in Power BI or your preferred BI tool that visualize the data from Azure Cost Management. Display costs per namespace over time, highlighting trends and identifying the most expensive workloads.
Once the showback model has matured and the cost allocation data is trusted, you can move to a chargeback model. In this model, the costs are formally cross-charged to the appropriate business unit’s budget. This creates direct financial accountability. However, it requires a high degree of accuracy and a clear, agreed-upon methodology for handling shared costs (e.g., the cluster control plane, monitoring tools).
Defining Your KPIs for Kubernetes Costs
To measure the effectiveness of your kubernetes cost management efforts, you need to establish clear Key Performance Indicators (KPIs). Move beyond just total Azure spend and focus on metrics that reflect efficiency:
- Cost per Namespace/Team: The fundamental metric for your showback/chargeback reports.
- CPU/Memory Utilization vs. Request: This measures the accuracy of resource requests. A large gap indicates significant waste from over-provisioning.
- Idle Resource Cost: The cost associated with resources that are provisioned but not allocated to any workload. Your goal is to drive this number as close to zero as possible.
- Node Utilization Percentage: Measures how effectively your VMs are being “packed” with workloads. Higher utilization means better efficiency.
Step 3: Optimizing AKS for Cost Efficiency
Cost optimization in AKS is a continuous process of aligning provisioned resources with actual demand. As a FinOps analyst, your role is to identify opportunities for optimization and provide the data that empowers engineering teams to take action.
Right-Sizing Workloads and Nodes
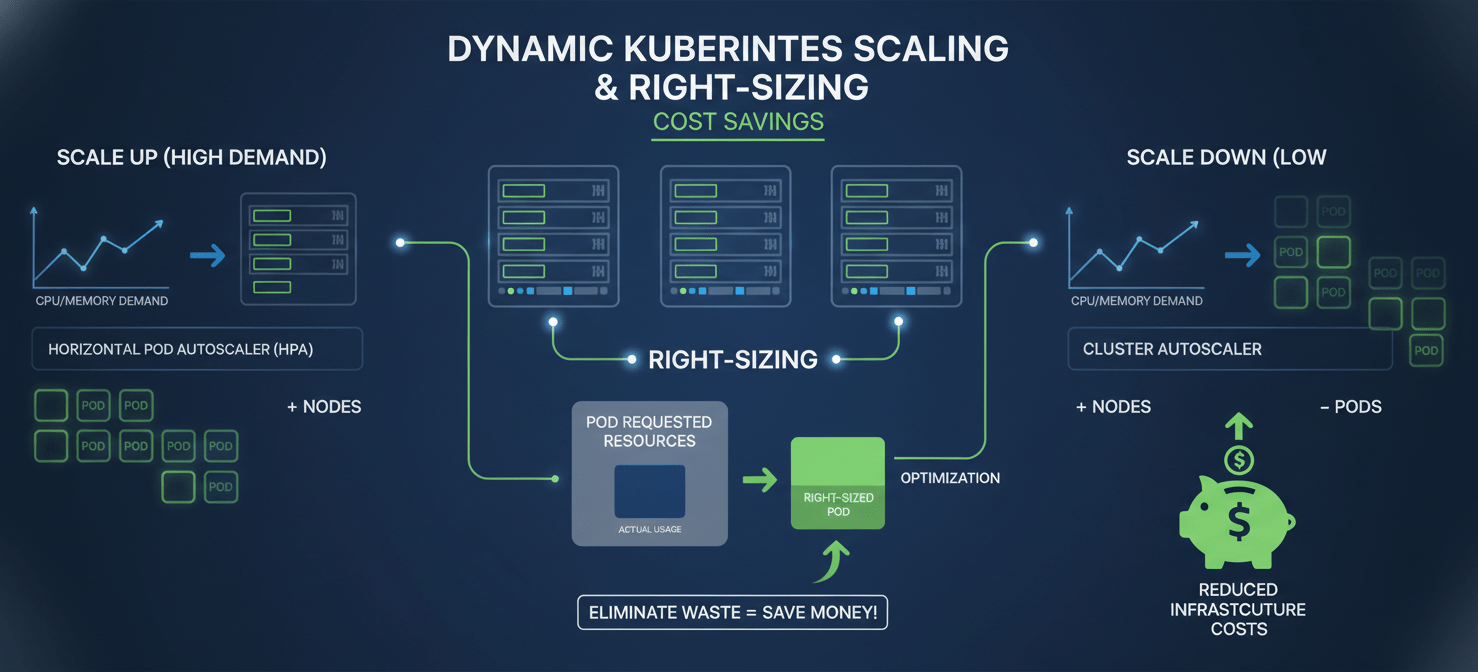
This is the most impactful optimization strategy. Developers often set high CPU and memory requests to be safe, but this is a primary source of waste. Use monitoring tools to compare the requested resources for pods against their actual peak usage over time.
Encourage teams to adopt a “start small and iterate” approach to resource requests. Tools like the Vertical Pod Autoscaler (VPA) can be run in recommendation mode to suggest more appropriate request and limit values based on historical usage.
Similarly, analyze the utilization of your node pools. If your nodes are consistently underutilized, you may be using VM instances that are too large. Consider creating multiple node pools with different VM sizes to better match diverse workload requirements.
Leveraging Autoscaling
Automation is critical for managing the dynamic nature of Kubernetes workloads. Azure provides two key mechanisms:
- Horizontal Pod Autoscaler (HPA): Automatically scales the number of pods in a deployment based on observed metrics like CPU utilization. This ensures you have enough replicas to handle load without paying for idle pods during quiet periods.
- Cluster Autoscaler: Automatically adjusts the number of nodes in a node pool. If pods are pending because there aren’t enough resources, it adds a node. If a node is underutilized for a period of time, it will be drained and removed, directly reducing your VM costs.
Using Spot and Reserved Instances
For workloads that can tolerate interruptions, such as batch jobs or development environments, Azure Spot Virtual Machines can offer discounts of up to 90% compared to pay-as-you-go prices. You can create dedicated node pools for Spot VMs in AKS.
For your steady-state, production workloads, Azure Reservations provide significant savings (up to 72%) in exchange for a one- or three-year commitment on your compute capacity. Your task is to analyze usage patterns to identify the baseline level of compute that can be safely covered by reservations.
Step 4: Building a Culture of Cost Accountability
Technology and tools are only part of the solution. A successful FinOps practice relies on a cultural shift where engineering teams take ownership of their cloud spending.

Your role is to facilitate this shift by:
- Providing Accessible Data: Make the cost and utilization dashboards readily available to developers. The data should be timely, accurate, and easy to understand.
- Integrating Cost into the Workflow: Work with DevOps teams to include cost estimation and impact analysis as part of the CI/CD pipeline. This provides feedback to developers before a change is even deployed.
- Establishing Governance: Create clear policies for resource requests, labeling, and the use of more expensive VM types. Use tools like Azure Policy to enforce these standards automatically.
- Celebrating Wins: When a team successfully reduces the cost of their application through optimization, publicize that success. This creates a positive feedback loop and encourages others to follow suit.
Conclusion
Effective kubernetes cost management on Azure is not a one-time project but a continuous, data-driven practice. It begins with creating granular visibility to understand who is spending what, and why. From there, you can implement showback models to build awareness, use automation to drive efficiency, and leverage Azure’s pricing models to maximize value. Your goal is not to be a gatekeeper of spending, but an enabler of efficiency—providing the data and frameworks that allow your engineering teams to innovate responsibly. The result is a more efficient, predictable, and cost-effective cloud platform where financial accountability is a shared responsibility, not an afterthought.
To transform your FinOps practice and achieve this level of granular visibility and accountability, you can easily begin a free Binadox trial or book a personalized demo to explore our comprehensive Kubernetes cost management solutions.
 7-day free trial