



As a DevOps engineer, you’re measured on uptime, deployment frequency, and lead time—not necessarily the monthly cloud bill. Yet, when a rogue process or a misconfigured autoscaling group quietly racks up thousands in unplanned spend, the fallout lands on your team. The problem is that traditional monitoring tools are built for performance metrics, not financial accountability. Achieving true cloud cost visibility requires a different approach, one that wires cost data directly into your operational dashboards and CI/CD pipelines. It’s about treating cost as a first-class metric, just like latency or error rates.
Key takeaways:
- A consistent tagging strategy is the foundation; without it, you can’t attribute costs accurately to teams, services, or environments.
- Native cloud cost tools are a starting point, but they fall short in multi-cloud environments and lack the detailed correlation needed for DevOps workflows.
- True visibility comes from correlating cost data with performance metrics in a unified cloud monitoring platform, turning raw billing files into actionable insights.
- Following a 4-step process of tagging, aggregation, correlation, and automation can systematically eliminate blind spots in your cloud spend.
Why Your Old Monitoring Tools Fall Short
Your existing observability stack is likely excellent at tracking CPU utilization, memory pressure, and application response times. However, it was not designed to interpret complex cloud billing data. Cloud providers generate massive, detailed billing files, but they lack the operational context your team needs. They tell you what you spent, but not why.

This gap leads to several practical problems:
- Delayed Reactions: Cost overruns are often discovered weeks later when the finance team flags an invoice, long after the engineering cause is buried under new deployments.
- Lack of Ownership: Without a clear way to attribute costs to a specific service, team, or even a single deployment, no one feels responsible for them. This creates a culture where cost is someone else’s problem.
- Fragmented Data: If you operate in a multi-cloud environment, you’re left trying to manually consolidate and normalize data from AWS, Azure, and GCP, each with its own billing structure and terminology. This manual effort is not scalable and is prone to errors.
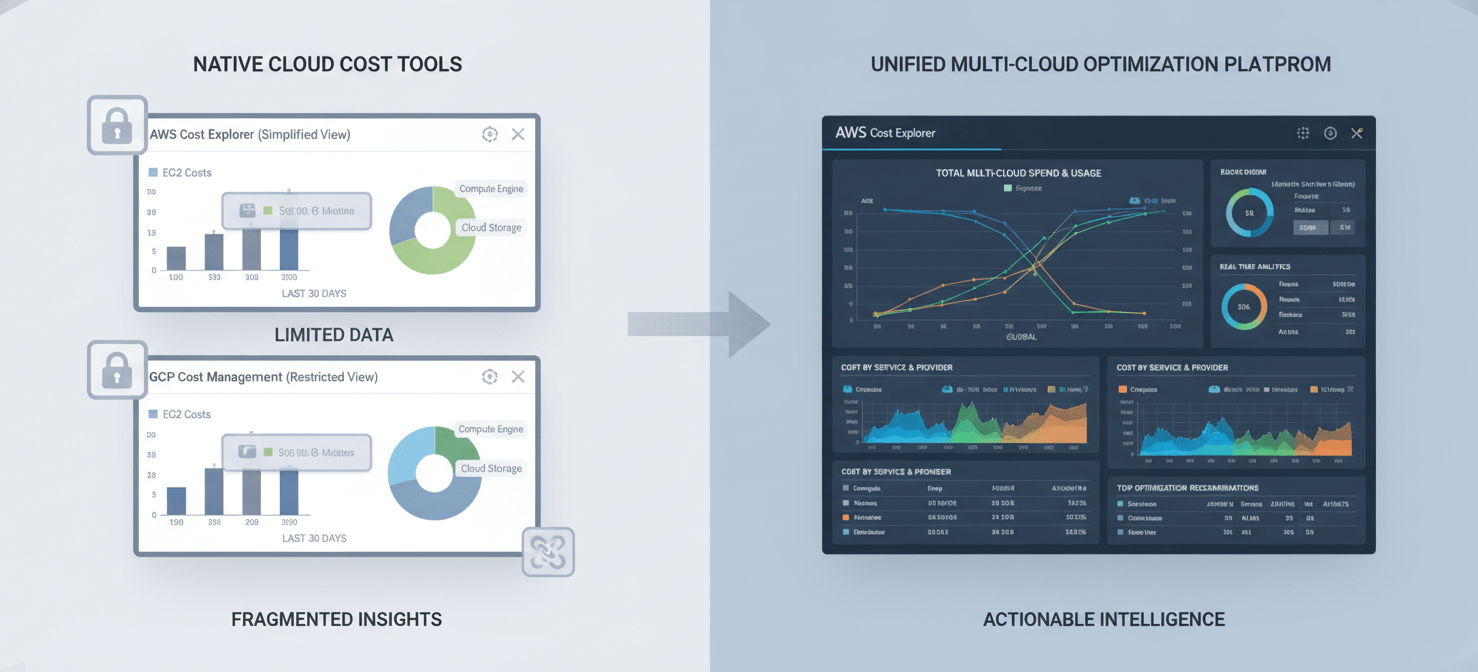
Native tools like AWS Cost Explorer or the GCP Cost Management tool offer basic visibility but are confined to their own ecosystems. They provide a high-level view but struggle to connect a cost spike to a specific code change or infrastructure drift. For a DevOps team, this isn’t actionable. You need to see the cost impact of a deployment in the same dashboard you use to monitor its performance.
Step 1: Implement a Consistent Tagging Strategy
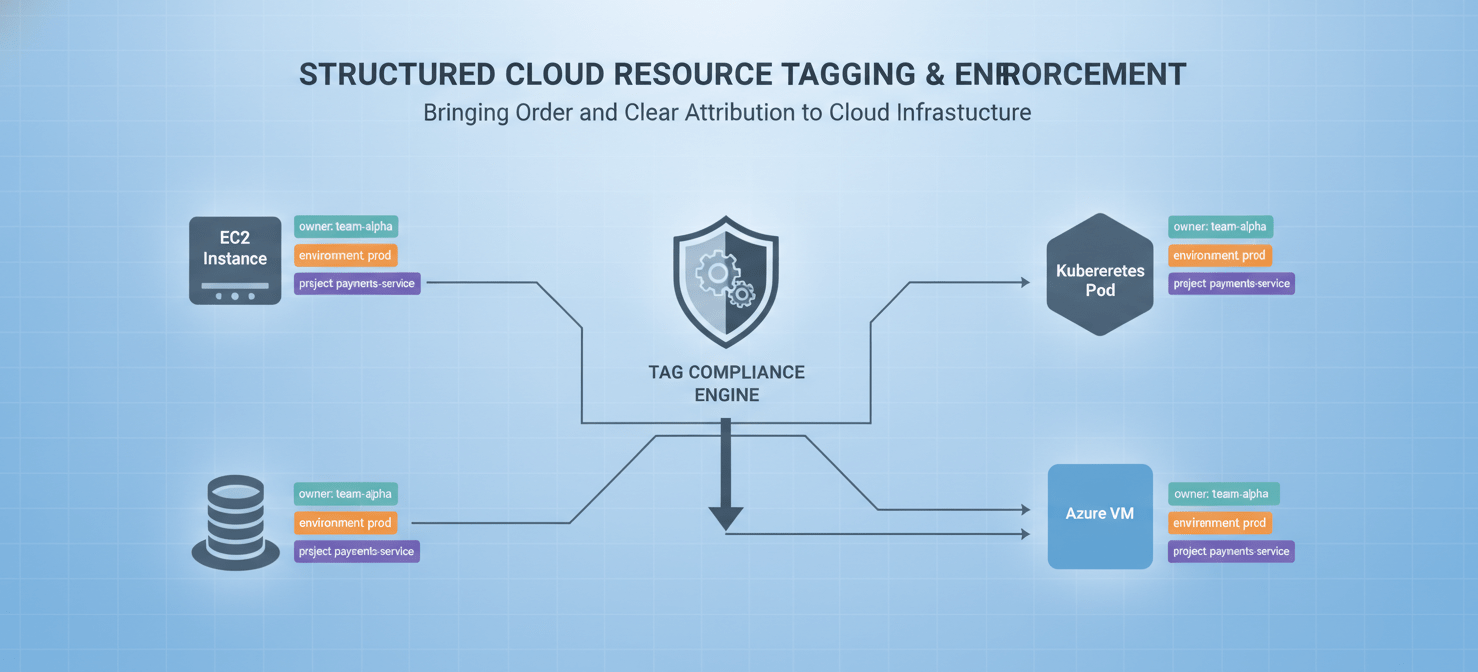
You cannot manage what you cannot measure, and you cannot measure cloud costs without a rigorous and enforced tagging strategy. Tags are simple key-value pairs that you attach to your cloud resources, but they are the fundamental building block for cost allocation and visibility. Without consistent tags, your cloud bill is just an opaque number.
Define a Standardized Tagging Policy
First, your team needs to agree on a mandatory set of tags for all provisioned resources. This policy should be documented and easily accessible. Start with a few essential tags that provide the most context:
owner: The email or team alias responsible for the resource.cost-center: The business unit or department to which the cost should be allocated.environment: The stage of the lifecycle (e.g.,prod,staging,dev).project: The specific application or service the resource belongs to.
Consistency is critical. Decide on a naming convention (e.g., lowercase, no spaces) and stick to it. An inconsistent tag like env:production versus environment:prod breaks your ability to filter and group costs accurately.
Automate and Enforce Tagging
Manual tagging is unreliable and doesn’t scale. Instead, build tagging directly into your infrastructure-as-code (IaC) templates. Whether you use Terraform, CloudFormation, or another tool, define required tags at the module level to ensure every resource is created with the necessary metadata.
Furthermore, use policy-as-code tools like Open Policy Agent (OPA) or native cloud provider services to enforce your tagging policy. For example, you can configure policies that prevent the creation of any resource missing a mandatory tag. This shifts enforcement “left,” catching compliance issues before they impact your billing data.
Step 2: Aggregate and Normalize Cost Data
With a solid tagging strategy in place, the next step is to bring all your cost and usage data into a single location. Relying on individual cloud provider consoles is inefficient, especially in a multi-cloud setup. Each provider has a unique billing data format, making direct comparisons difficult.
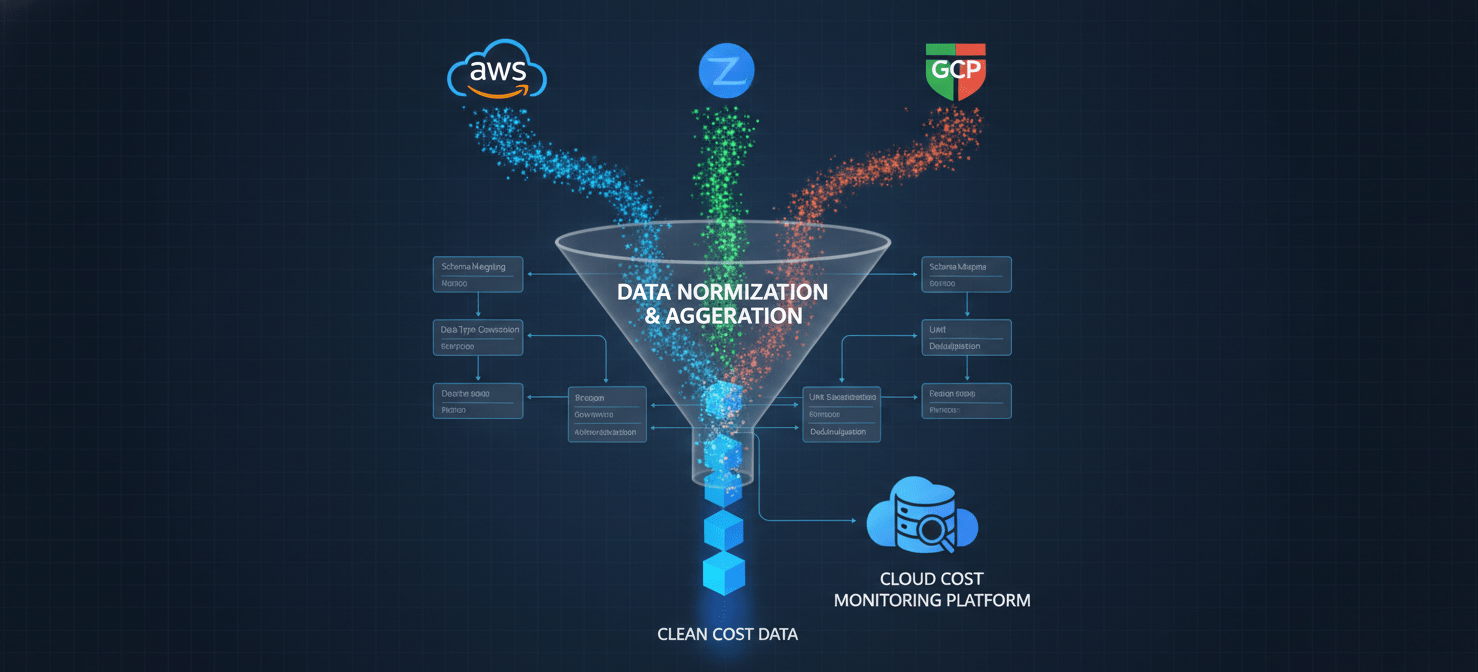
Your goal is to create a single source of truth for all cloud spending. This typically involves exporting detailed billing data from each provider into a central data warehouse or a specialized cloud monitoring platform.
- AWS: Use the Cost and Usage Report (CUR) to get the most granular billing data.
- GCP: Export your detailed billing data to BigQuery.
- Azure: Configure recurring exports from Azure Cost Management to a storage account.
Once the data is centralized, it must be normalized. This process involves standardizing disparate fields (e.g., instance types, region names, pricing units) into a common format. For example, you would map AWS’s t3.micro and GCP’s e2-micro to a common “micro” instance category for easier comparison. This normalization is a key feature of many third-party cost management platforms, saving your team significant data engineering effort.
Step 3: Correlate Cost with Performance Metrics
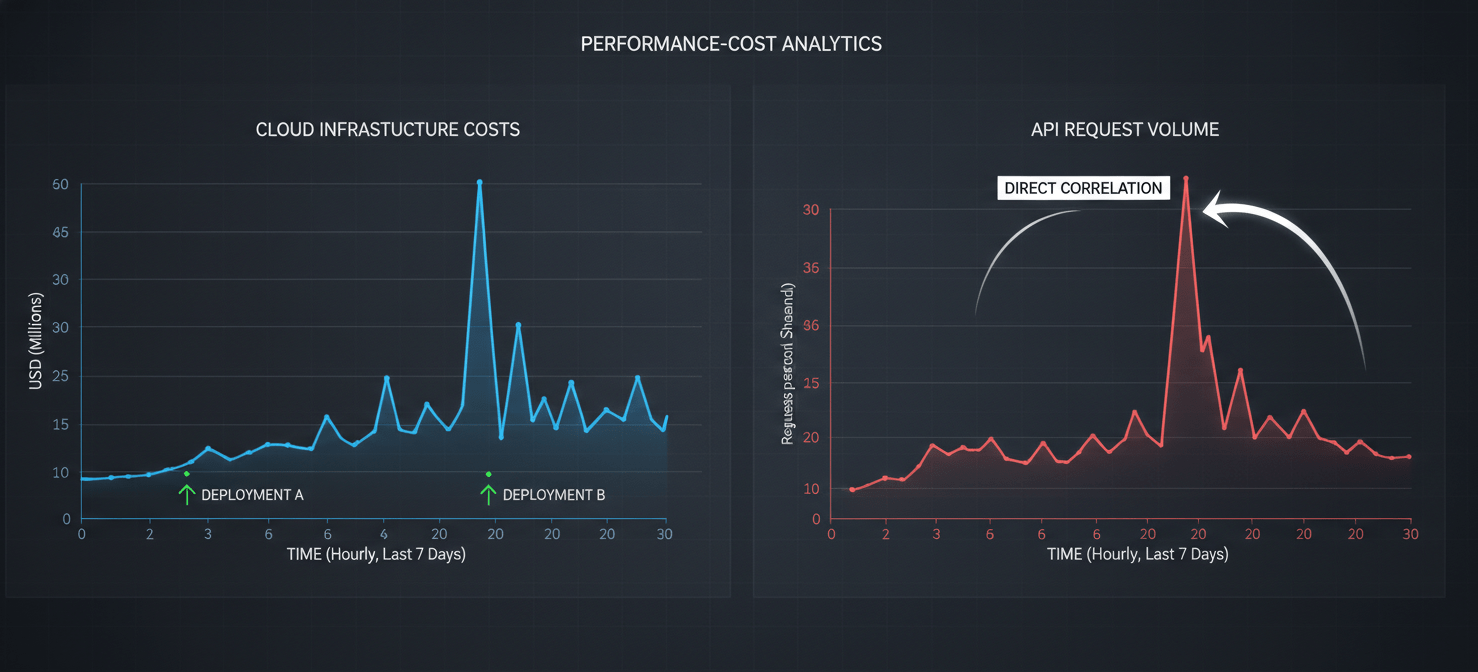
This is where true cloud cost visibility begins to take shape for a DevOps team. Raw cost data is useful for finance, but for engineers, it becomes powerful when correlated with the performance and usage metrics you already monitor. When you can overlay a spike in S3 costs with an increase in application log output, you can pinpoint the root cause in minutes, not weeks.
Unify Cost and Observability Data
Integrate your normalized cost data into your primary observability platform, whether it’s Datadog, Grafana, or another tool. This allows you to build dashboards that show cost alongside metrics like:
- CPU and memory utilization
- API request counts and latency
- Deployment markers from your CI/CD pipeline
- Kubernetes pod counts and resource requests
For example, you could create a dashboard for your payments service that displays its daily cost trend next to its transaction volume and error rate. If a new deployment causes a memory leak, you’ll see both the memory utilization and the corresponding cost of the larger instances simultaneously climb. This direct correlation transforms cost from an abstract financial number into a concrete operational metric.
Calculate Unit Costs
To take this a step further, work with your product and finance teams to define meaningful unit cost metrics. Instead of just tracking the total cost of your infrastructure, calculate metrics that align with business value, such as:
- Cost per active user
- Cost per transaction
- Cost per gigabyte of data processed
Tracking these KPIs provides a much richer understanding of your application’s efficiency. A rising total cost might be acceptable if your user base is growing, but a rising cost per user indicates a potential inefficiency in your architecture that needs investigation.
Step 4: Automate Anomaly Detection and Reporting
The final step is to automate the process of monitoring and responding to cost issues. Manual dashboard checks don’t scale in a dynamic cloud environment where infrastructure changes multiple times a day.
Configure Intelligent Anomaly Detection
Use a cloud monitoring platform or build your own tooling to establish baselines for normal spending patterns for each service, team, and environment. Modern anomaly detection systems use machine learning to understand historical spend and identify statistically significant deviations.
These alerts should be far more sophisticated than simple budget thresholds. A budget alert that fires on the 25th of the month is useless. Instead, an effective anomaly alert should trigger in near real-time when, for example, the cost of a specific development environment suddenly increases by 300% overnight.
Integrate Alerts into Your DevOps Workflow
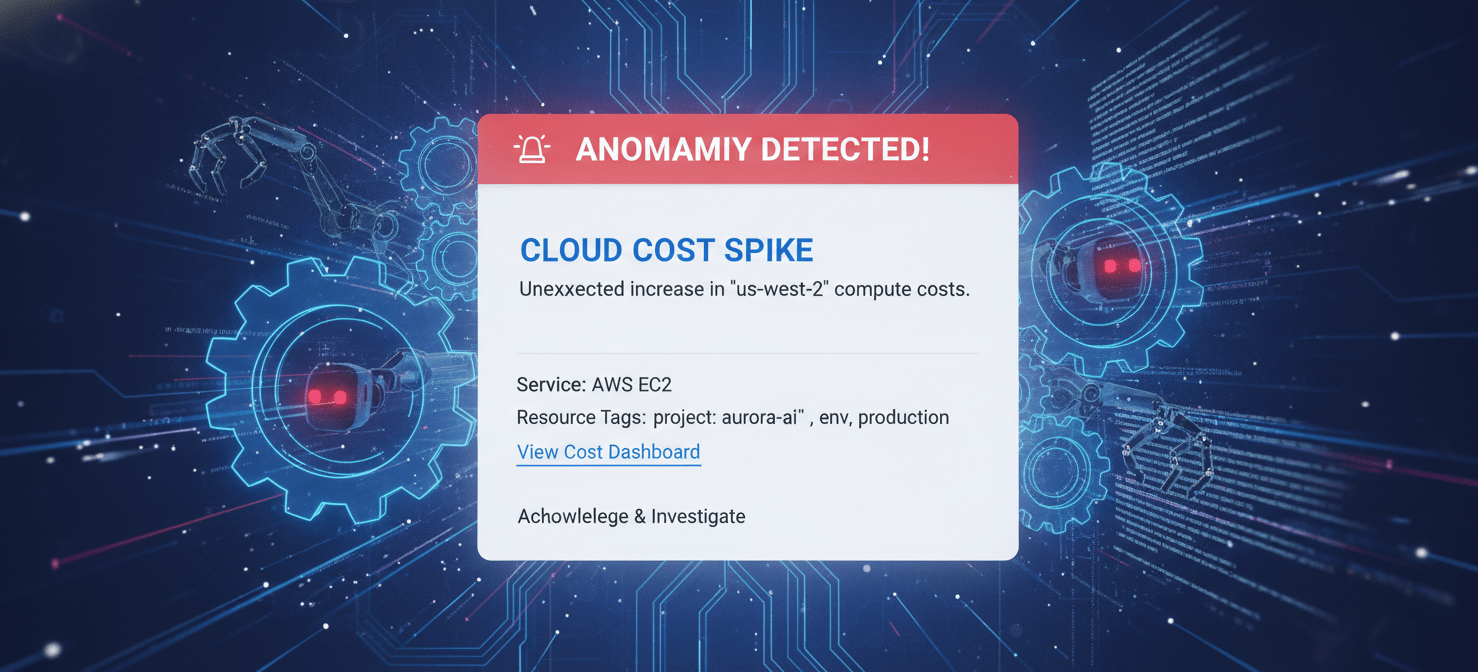
Route these cost anomaly alerts directly into the tools your team already uses, such as Slack, Microsoft Teams, or PagerDuty. The alert should contain rich context, including:
- The service or project responsible for the cost spike.
- The specific resource tags associated with the anomaly.
- A link to a dashboard showing the cost spike correlated with performance metrics.
This closes the loop, turning visibility into action. When an engineer receives a detailed, context-rich alert in their primary chat tool, they can immediately investigate and remediate the issue, preventing a minor leak from becoming a major budget overrun.
Gaining True Cloud Cost Visibility: Beyond Native Tools
While native tools like AWS Cost Explorer and the gcp cost explorer provide a necessary starting point, achieving the level of granular, actionable insight that a DevOps team needs often requires moving beyond them. Their limitations in multi-cloud environments and their inability to deeply correlate cost with operational data mean they often leave you with more questions than answers. True cloud cost visibility isn’t just about looking at billing data in a new dashboard; it’s about fundamentally integrating cost into the engineering culture and workflows.
By implementing a disciplined tagging strategy, aggregating data into a single source of truth, correlating it with performance metrics, and automating anomaly detection, you can transform cloud cost from a reactive financial problem into a proactive operational discipline. This approach empowers your team to make smarter architectural decisions, identify inefficiencies faster, and ultimately build more cost-effective systems without sacrificing the speed and agility that DevOps provides.
Conclusion
The days of treating cloud spend as a distant, abstract concern for the finance department are over. In a modern DevOps culture, engineers are empowered to provision infrastructure, and with that power comes the responsibility of ownership. Achieving true cloud cost visibility is the critical enabler for this shift. It requires moving beyond the native billing consoles and building a system that treats cost as a core operational metric, right alongside performance and reliability. It’s not about saving money by moving slower; it’s about building better, more efficient systems by having the right data at the right time. After all, an unexpected seven-figure cloud bill is a far more disruptive incident than a minor deployment rollback.
If you’re ready to transform your cloud cost management into a proactive operational discipline, you can begin exploring Binadox with a complimentary trial or schedule a personalized demonstration to see its full capabilities.
 7-day free trial