



For any FinOps team, wrangling cloud costs is a primary objective. Yet, within the vast landscape of AWS services, Amazon S3 presents a particularly nuanced challenge. Its costs are driven by multiple dimensions—not just storage volume, but also requests, data transfers, and management features. Without a clear strategy, S3 buckets can become costly black boxes, making accurate showback and chargeback nearly impossible. Effective S3 cost allocation is not just about tracking expenses; it’s about driving accountability and enabling data-driven decisions for cost optimization.
This article provides a practical framework for FinOps leads and cost analysts to master S3 cost reporting. You will learn how to move from murky, aggregated bills to clear, actionable attribution dashboards that connect S3 spending to specific teams, projects, and business units.
Key takeaways:
- A comprehensive tagging policy is the non-negotiable foundation for any S3 cost allocation strategy, aiming for at least 85-90% of spend to be taggable.
- Activating user-defined tags as “cost allocation tags” in the AWS Billing console is a critical step that enables filtering and grouping within AWS Cost Explorer and Cost and Usage Reports.
- Leverage native AWS tools like Cost Explorer for high-level analysis and S3 Storage Lens for granular, prefix-level insights to build robust attribution dashboards.
- For the most detailed analysis, combine AWS Cost and Usage Reports (CUR) with Amazon Athena to query raw billing data directly.
Why S3 Cost Allocation is a Unique Challenge
Unlike the more predictable costs of an EC2 instance, S3 billing is multifaceted. A single bucket’s monthly cost is a blend of storage pricing tiers, API request fees (GET, PUT, LIST), data retrieval charges for colder storage classes, and data transfer costs. This complexity makes it difficult to answer a seemingly simple question: “How much is Project X’s S3 usage costing us?”

Shared buckets further complicate attribution. Often, multiple applications, teams, or microservices write to a single, large S3 bucket for operational simplicity. While this may be efficient for developers, it creates a nightmare for cost analysts. When the bill arrives, it shows a single, large charge for the bucket, with no native breakdown of which tenant is responsible for what portion of the storage, requests, or data transfer fees. This is where a deliberate allocation strategy becomes essential for accurate AWS S3 showback.
Foundational Strategy: A Rock-Solid Tagging Policy
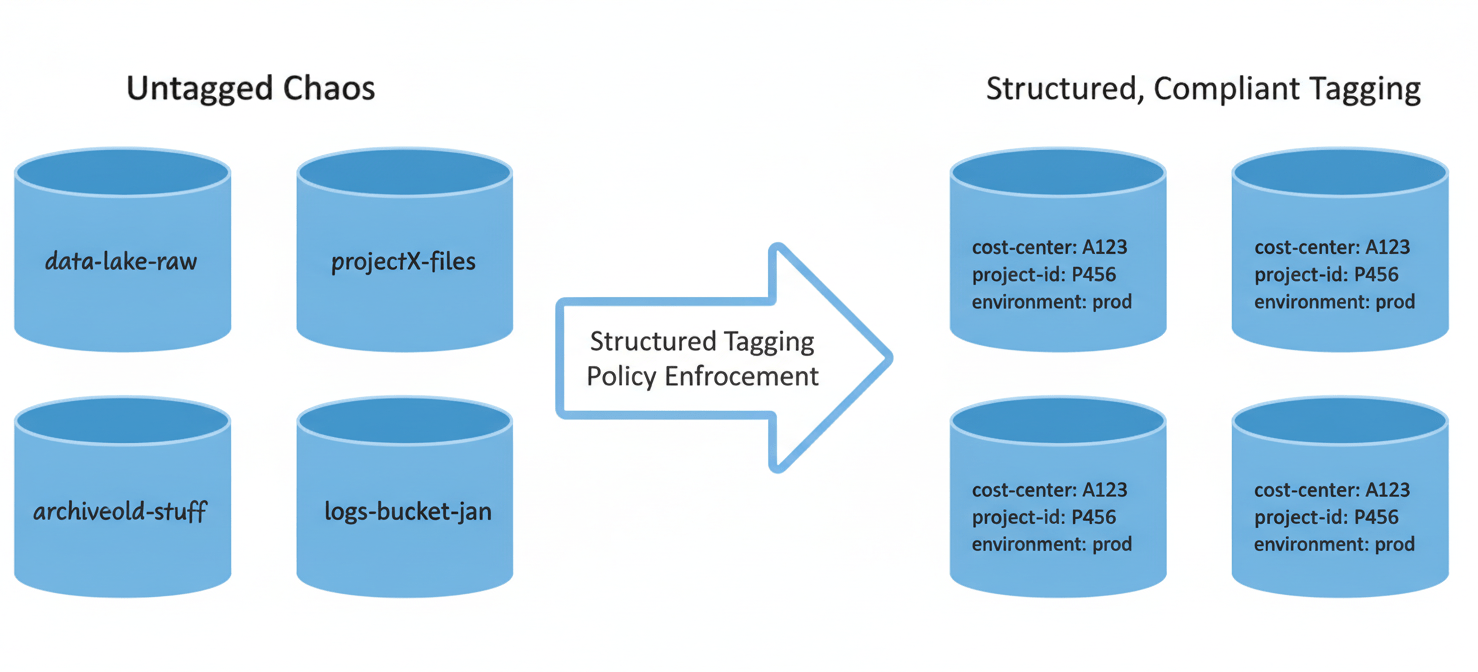
You cannot allocate what you cannot identify. The cornerstone of any effective S3 cost allocation effort is a mandatory, enforced, and consistent tagging policy. Tags are simple key-value pairs that act as metadata for your AWS resources, including S3 buckets. For FinOps purposes, these tags must align with your business structure.
Defining Your Tagging Schema
Before creating a single tag, your team must define a schema that reflects how your organization needs to see costs. Collaborate with engineering and business leaders to standardize keys. Common and effective tag keys for cost allocation include:
cost-center: The business unit or department ID responsible for the cost.project-id: A specific project or application identifier.team-owner: The engineering team responsible for the resource.environment: The deployment stage (e.g.,prod,dev,staging).
A consistent naming convention for S3 buckets themselves can also aid in organization and prevent misconfigurations. For example, a pattern like {org}-{env}-{purpose} can provide immediate context.
Enforcing Tagging Compliance
A policy is only as good as its enforcement. Relying on manual tagging is a recipe for incomplete data. Instead, you should automate and enforce your policy using tools like:
- AWS Service Catalog: Ensure that any S3 buckets provisioned through Service Catalog automatically include the required tags.
- Infrastructure as Code (IaC): Embed tagging requirements directly into your Terraform, CloudFormation, or CDK templates.
- AWS Config Rules: Create rules that continuously check S3 buckets for compliance with your tagging policy and flag or even remediate non-compliant resources.
- Tag Policies in AWS Organizations: Centrally define and enforce tagging standards across all accounts in your organization.
The goal is to make correct tagging the path of least resistance for engineering teams.
Activating Cost Allocation Tags
Simply applying tags to your S3 buckets is not enough. For the tags to become useful filters in your billing tools, you must activate them within the AWS Billing and Cost Management console.
There are two types of cost allocation tags: AWS-generated (like aws:createdBy) and user-defined. For your custom schema (cost-center, project-id, etc.), you must explicitly activate each user-defined tag key.
Navigate to the “Cost Allocation Tags” section of the Billing console. Here, you will see a list of all user-defined tags discovered across your AWS resources. Find the keys you defined in your policy, select them, and click “Activate.” It can take up to 24 hours for these tags to become active and appear as filters in AWS Cost Explorer and your Cost and Usage Reports (CUR).
Analyzing and Visualizing S3 Costs
Once your tags are active, you can begin the real work of analysis and attribution. AWS provides several native tools designed for this purpose, each suited to different levels of granularity.
AWS Cost Explorer: The 30,000-Foot View
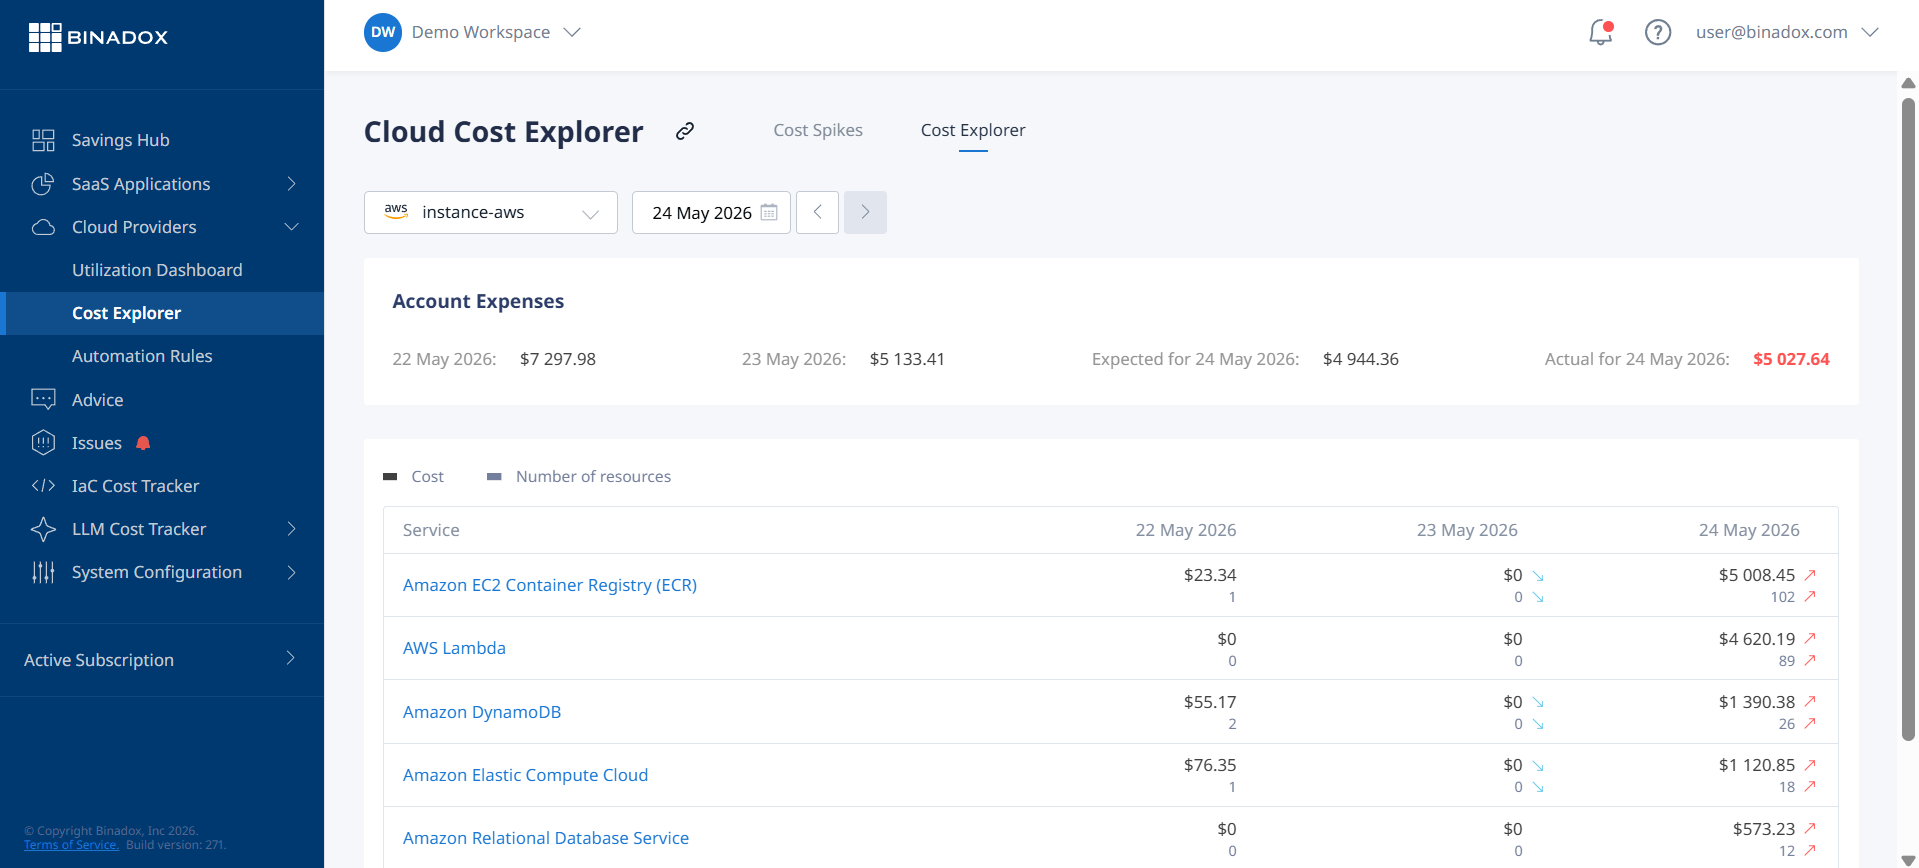
AWS Cost Explorer is your primary tool for high-level S3 cost reporting and trend analysis. After activating your tags, they will appear as a “Group by” dimension and a filter option.
To create a basic S3 showback report:
- Open Cost Explorer and set the date range.
- Filter by Service and select S3 (Simple Storage Service).
- Use the Group by dropdown and select your activated tag key, such as
Tag: cost-center.
The resulting chart will display a breakdown of your S3 costs attributed to each cost center. You can save this view as a report and share it with stakeholders. This is often the first and most powerful step in building accountability. You can further refine the report by filtering out untagged resources to see the impact of your compliance efforts.
S3 Storage Lens: For Granular Bucket-Level Insights
While Cost Explorer is excellent for account-level views, S3 Storage Lens provides deep, operational metrics down to the prefix level within a bucket. This is invaluable when a single bucket is shared by multiple teams or applications.
Storage Lens dashboards can show you metrics like total storage, object count, and average object size. The advanced metrics tier, which comes at a cost, allows you to aggregate these metrics by prefix. By establishing a naming convention for prefixes within a shared bucket (e.g., /project-a/, /project-b/), you can use Storage Lens to approximate the storage consumption of each tenant. This data can then be used to proportionally allocate the shared bucket’s costs.
Advanced S3 Cost Allocation Techniques
For the most precise and flexible S3 cost reporting, you need to go beyond the console and query the raw billing data directly.
AWS Cost and Usage Report (CUR) + Amazon Athena
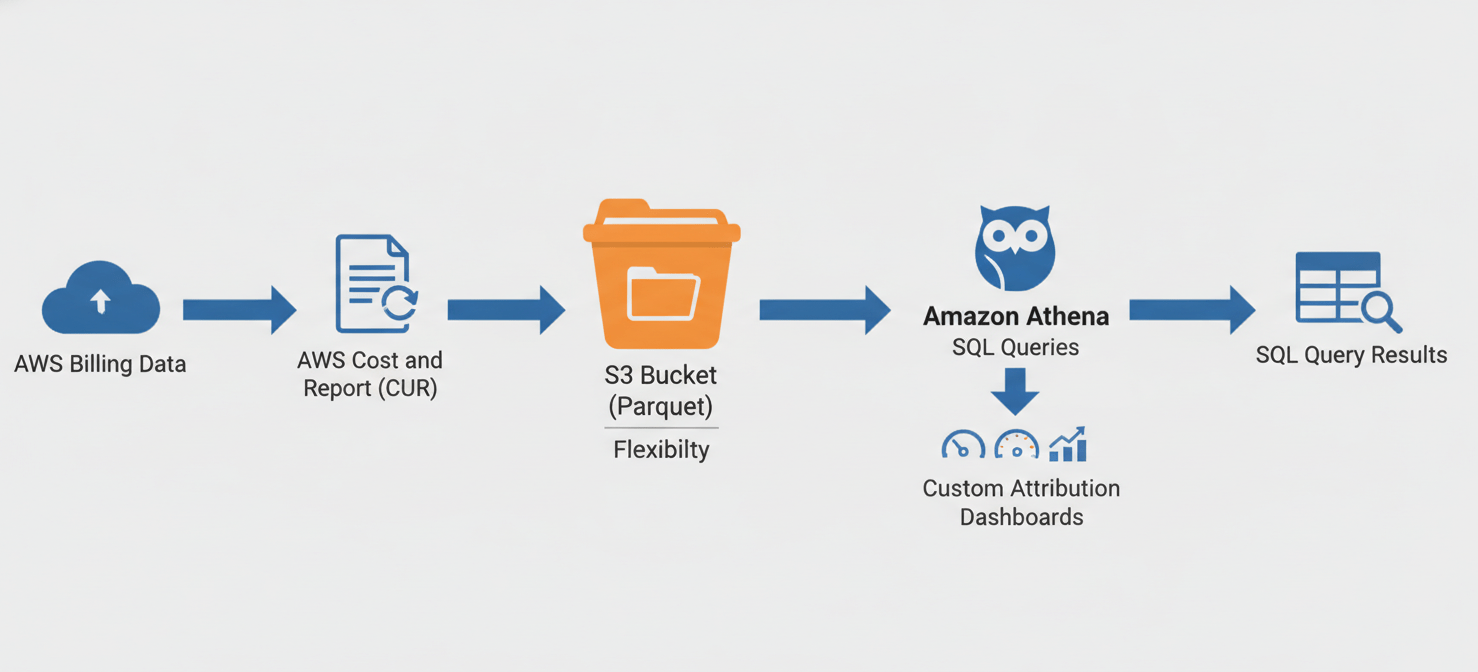
The AWS Cost and Usage Report (CUR) is the most comprehensive source of billing data available. It provides hourly, resource-level details for every single charge. When you configure your CUR, you can have it delivered to an S3 bucket in Parquet format and integrated with Amazon Athena.
Athena is a serverless query service that lets you run standard SQL queries on the data in your CUR files. This unlocks powerful analysis capabilities. For example, you can write queries to:
- Calculate the total cost (storage, requests, and transfer) for every bucket tagged with a specific
project-id. - Identify the top 10 most expensive buckets for a given
cost-center. - Analyze request costs by API operation (
GetObject,PutObject, etc.) for specific buckets to identify optimization opportunities.
This approach provides the ultimate flexibility for building custom attribution dashboards and KPIs that align perfectly with your business needs.
Implementing Chargeback and Showback Models
With reliable data from your tagging and analysis, you can implement formal showback or chargeback models.
- Showback: You report on the cost of S3 usage to the relevant business units, driving awareness and accountability without a formal cross-charge. Dashboards built from Cost Explorer or Athena are perfect for this.
- Chargeback: You formally bill the S3 costs back to the respective departments’ budgets. This requires a high degree of confidence in your data accuracy, making the CUR + Athena method the most suitable foundation.
Start with showback. Once teams trust the data and understand how their actions impact costs, you can graduate to a full chargeback model.
Putting It All Together: From Data to Decisions
Effective S3 cost allocation is a continuous process, not a one-time project. It begins with the foundational discipline of a strictly enforced tagging policy. From there, you activate those tags to unlock filtering and grouping capabilities in AWS Cost Explorer, providing immediate visibility for showback. For deeper, more granular analysis of shared resources, you leverage S3 Storage Lens and the powerful combination of the Cost and Usage Report with Amazon Athena.
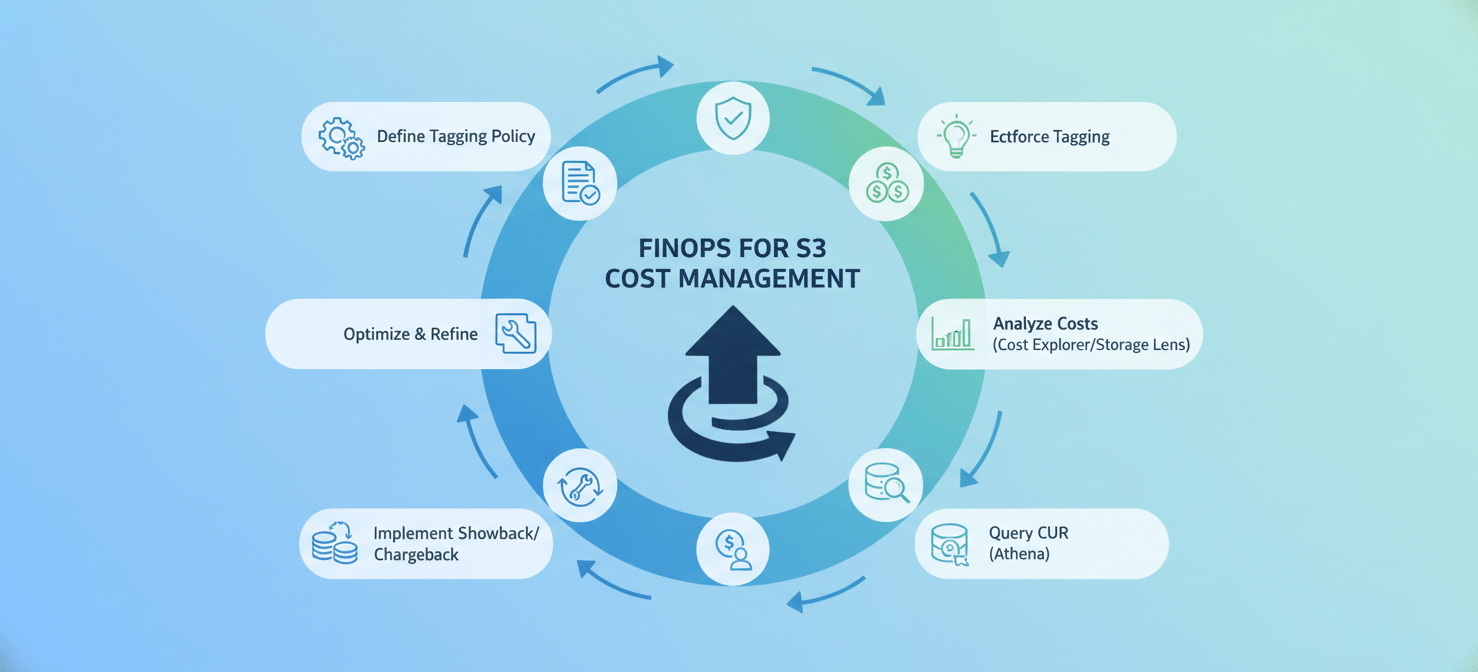
The ultimate goal is not just to report on costs, but to influence behavior. When an engineering team can see a direct correlation between a new feature launch and a spike in their S3 bill, they are empowered to make more cost-aware architectural decisions. Your role in FinOps is to provide that clear, accurate, and actionable data. Stop treating S3 as a monolithic expense; start treating it as a collection of discrete, attributable business costs. After all, you can’t optimize what you can’t measure.
To transform your S3 spending into clear, actionable data and drive optimization, consider exploring a free Binadox trial or connecting with our team to book a demo of our FinOps platform.
 7-day free trial