



AWS Savings Plans offer a flexible way to reduce your cloud bill by up to 72% compared to On-Demand prices, but realizing those savings requires vigilance. Simply purchasing a plan is not enough; you must actively monitor its performance to ensure your commitment aligns with your actual usage. Without a clear strategy to track AWS Savings Plan performance, you risk paying for committed resources that go unused, silently eroding your potential savings. This guide provides a practical walkthrough of the tools and metrics you need to stay on top of your commitments and maximize your return on investment.
Key takeaways:
- Use AWS Cost Explorer as your primary tool. It provides two essential reports—Utilization and Coverage—for monitoring Savings Plan effectiveness.
- Aim for 100% utilization. A utilization rate below 98% suggests you have over-committed and are paying for compute capacity you are not using.
- Analyze costs daily. To get a true sense of daily expenses, switch from the default “Unblended” view to “Amortized costs” in Cost Explorer’s advanced options.
- Balance two key metrics. High utilization is good, but low coverage means you’re missing savings opportunities. The goal is to achieve both high utilization and high coverage.
Why Tracking Savings Plan Performance Is Crucial
Savings Plans require you to commit to a consistent amount of compute usage, measured in dollars per hour, over a one- or three-year term. If your actual usage drops below this hourly commitment, you still pay the full committed amount. This is known as underutilization, and it directly translates to wasted spend. For example, a 30% underutilization on a $500,000 annual commitment results in $150,000 of pure waste.
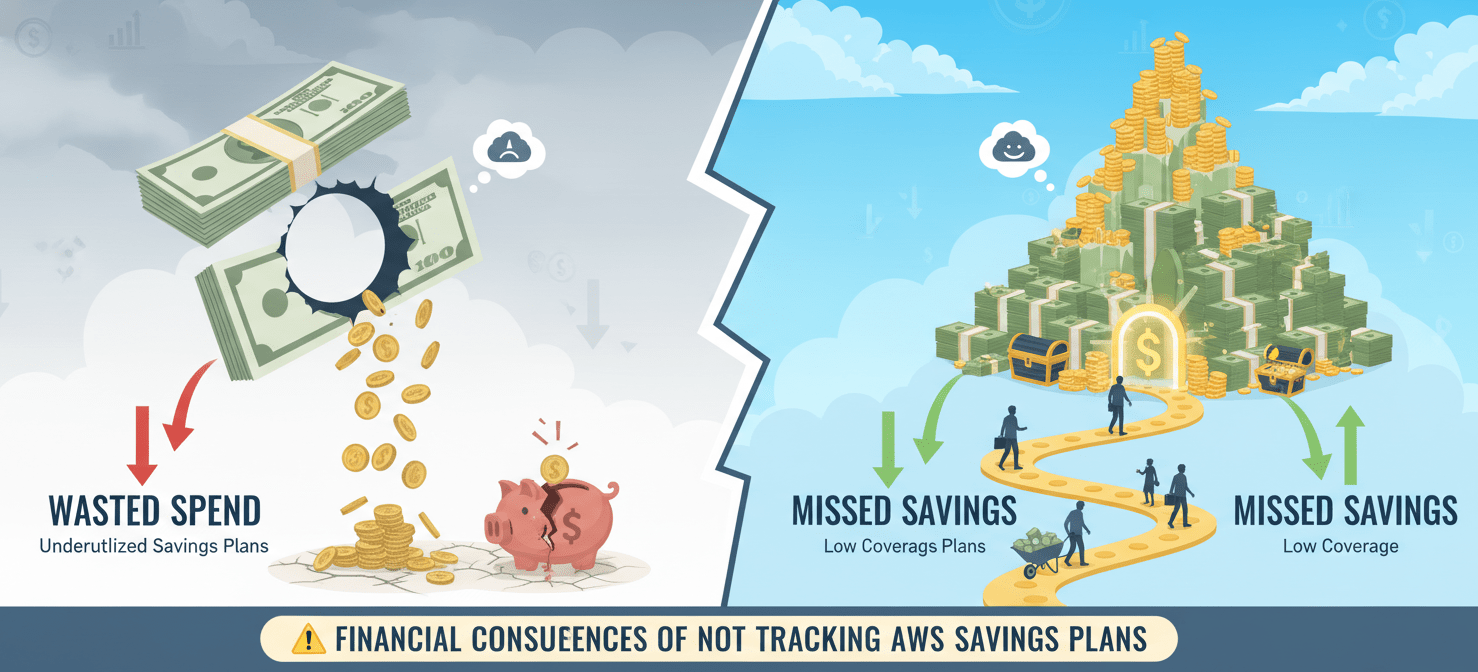
Furthermore, tracking performance helps you identify if you have under-committed. If your teams consistently use more resources than your plan covers, they are paying higher On-Demand rates for that excess usage. This represents a missed savings opportunity. Regular monitoring allows you to make data-driven decisions about when to purchase additional plans to increase your coverage.
Finally, effective tracking provides the financial visibility needed for accurate budgeting and forecasting. By understanding how your commitments are being used, you can better predict future cloud spend and demonstrate the value of your FinOps practice to the organization.
How to Track AWS Savings Plan Performance Using AWS Cost Explorer
AWS Cost Explorer is the native tool for monitoring your Savings Plans. Before you can use it, you must enable it in the AWS Billing and Cost Management console, which can take up to 24 hours to populate with data. Once enabled, you can access several key reports.
Accessing the Core Reports
To begin your analysis, navigate to the AWS Cost Management console. In the left-hand navigation pane, under “Savings Plans,” you will find the two most important reports for performance tracking: Utilization report and Coverage report.
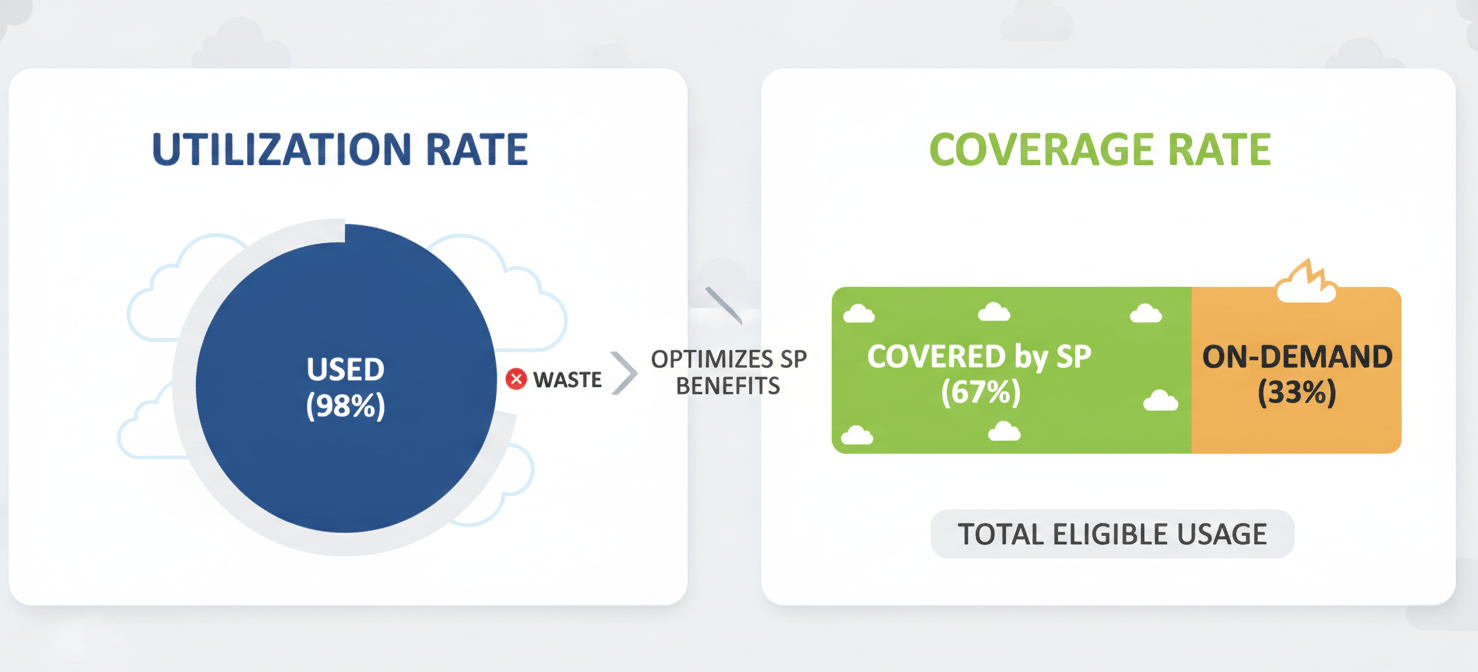
- The Utilization report shows what percentage of your hourly commitment you are actually using.
- The Coverage report shows what percentage of your eligible compute usage is covered by a Savings Plan.
You can filter these reports by time period (daily, monthly), account, region, and more to get a granular view of your performance.
Understanding Key Savings Plan Metrics
To effectively track performance, you need to understand the difference between utilization and coverage. It is possible to have high utilization but low coverage, or vice versa. The optimal state is to have high levels of both.
Utilization Rate
Utilization measures how effectively you are using your committed spend. It is calculated by dividing the cost of the usage covered by your Savings Plan by the total cost of your commitment. For instance, if you have a $10/hour commitment and your usage covered by the plan totals $9.80 in a given hour, your utilization is 98%.
- High Utilization (98-100%): This is the ideal scenario. It means you have accurately matched your commitment to your usage, minimizing waste.
- Low Utilization (<90%): This indicates over-commitment. You are paying for a commitment that your workloads are not fully using, which results in wasted money.
You can view your utilization report directly in the AWS console to monitor this metric.
Coverage Rate
Coverage measures how much of your total eligible compute spend (for services like EC2, Lambda, and Fargate) is benefiting from discounted rates. For example, if your total eligible compute usage in an hour would have cost $25 at On-Demand rates, and your Savings Plan covered $12 worth of that usage, your coverage is 48%.
- High Coverage: This means most of your predictable workloads are receiving discounts, maximizing your savings.
- Low Coverage: This signals that a significant portion of your usage is being billed at expensive On-Demand rates, indicating a missed opportunity to save more.
The Savings Plans coverage report in the console provides these insights.
Analyzing Daily and Hourly Savings Plan Costs
To accurately view daily savings plan cost, you must look beyond the default view in Cost Explorer. The standard “Unblended costs” view can be misleading, as it shows upfront payments as a single large spike on the day of purchase.
Using Amortized Costs for a True Daily View
For a more accurate, accrual-based view, you should use the amortized cost feature. This spreads any upfront fees evenly over the entire term of the Savings Plan, showing you a consistent and predictable daily effective rate.
To enable this view:
- Navigate to Cost Explorer.
- In the right-hand panel, find Advanced Options.
- Click the dropdown under “Cost Type” and change it from “Unblended costs” to Amortized costs.
The chart will update to show a flattened, more realistic daily cost, making it much easier to analyze trends and spot anomalies. This view is essential for understanding the true daily financial impact of your commitments.
Optimizing Your Savings Plan Commitment
Tracking performance is not just about observation; it’s about taking action. The data from Cost Explorer should inform your purchasing strategy.
Leveraging AWS Recommendations
AWS Cost Explorer analyzes your historical usage (over 7, 30, or 60 days) and provides tailored recommendations for new Savings Plan purchases. These recommendations estimate your potential monthly savings and suggest an hourly commitment. You can find these by navigating to Savings Plans > Recommendations in the console.
However, these recommendations are backward-looking. Before acting on them, ensure your environment is already optimized. This includes:
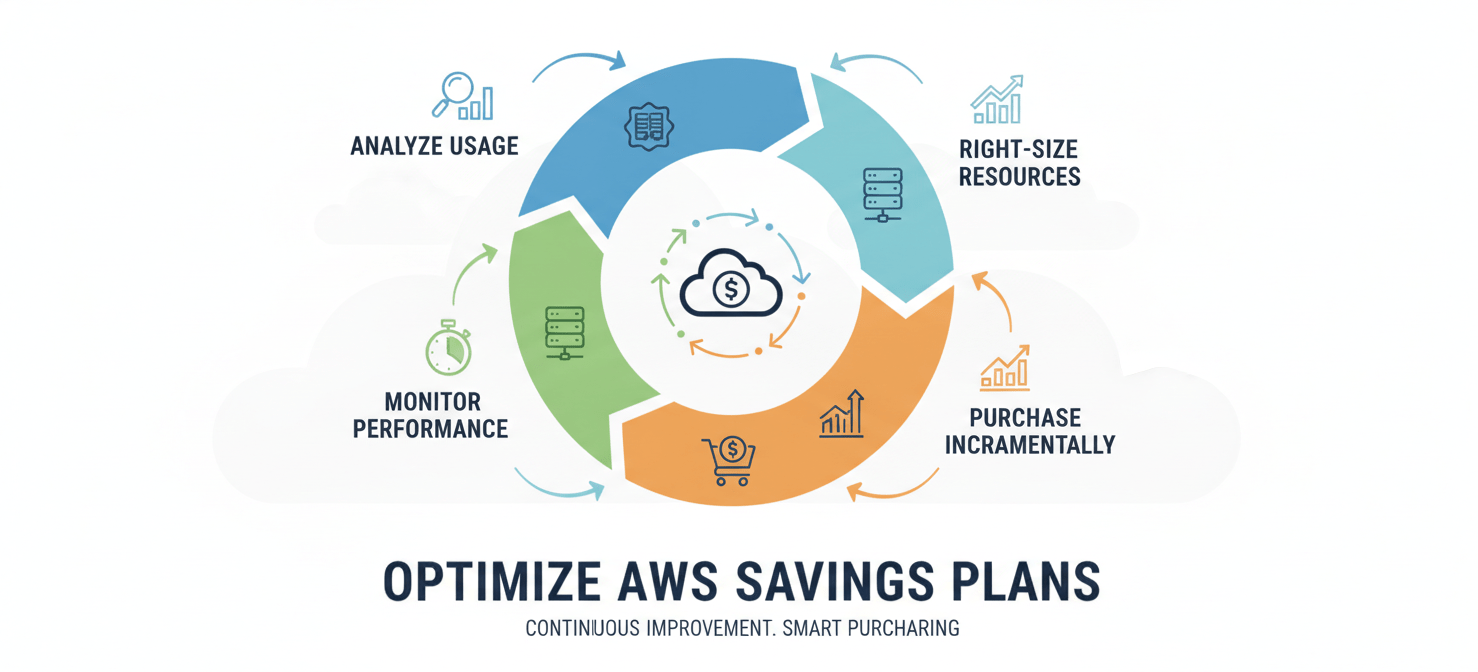
- Right-sizing instances: Use tools like AWS Compute Optimizer to eliminate over-provisioned resources.
- Deleting unused resources: Remove idle EBS volumes and other legacy infrastructure.
Committing to a plan based on wasteful usage only locks in that waste at a discount.
Purchasing Incrementally
You do not need to purchase your entire recommended commitment at once. A smarter approach is to buy in smaller, incremental cycles. Start with a conservative commitment that covers your absolute baseline usage. Monitor your utilization and coverage for a period, and then purchase additional plans as your usage patterns stabilize and grow. This iterative approach helps prevent over-commitment while allowing you to increase savings over time.
Conclusion
Successfully managing AWS costs requires more than just buying a Savings Plan; it demands a disciplined approach to performance monitoring. By regularly using the aws savings plan cost explorer and focusing on the core metrics of utilization and coverage, your team can gain clear visibility into both realized savings and missed opportunities. The key is to transform this data into action—right-sizing resources before committing, purchasing incrementally, and using the amortized view to understand true daily costs. Failing to track aws savings plan performance is akin to navigating without a map; you might be moving, but you are almost certainly not heading in the most cost-efficient direction.
To move beyond manual tracking and gain deeper insights into your cloud spend, you might explore a specialized platform; you can begin a free Binadox trial to experience its capabilities firsthand or schedule a demo to see how it fits your specific needs.
 7-day free trial