



Azure Kubernetes Service (AKS) simplifies deploying and managing containerized applications. However, the detailed logging it provides through Azure Monitor and Log Analytics can lead to escalating expenses. If you’re facing unexpectedly high bills, you’re not alone. The key is to proactively manage and optimize your data ingestion. This guide provides practical steps to understand and reduce your AKS log analytics costs without sacrificing essential visibility.
Key takeaways:
- You can reduce data collection by up to 90% by disabling specific log types like stdout and environment variables.
- Implementing data collection rules (DCRs) provides granular control over what logs and metrics are ingested.
- Regularly analyzing your data usage in the Log Analytics workspace is the first step to identifying cost-saving opportunities.
- Setting a daily cap on your Log Analytics workspace can prevent unexpected cost overruns.
Understanding What Drives Your AKS Log Analytics Costs
Before you can cut costs, you need to understand what you’re paying for. The primary driver for Azure Monitor for containers is data ingestion—the volume of log and metric data your AKS clusters send to your Log Analytics workspace. This data is billed per gigabyte (GB) ingested.
Several types of data contribute to this volume:
- Container Logs: These include stdout (standard output) and stderr (standard error) logs from every container in your cluster. Verbose applications can generate a massive amount of data.
- Performance Metrics: Prometheus metrics, scraped by Azure Monitor’s agent, track the performance of nodes and pods. While essential, not all default metrics may be necessary for your environment.
- Cluster Events: Kubernetes events, while useful for debugging, can also add to the data volume.
- Inventory Data: Information about your cluster’s configuration and resources is collected periodically.
To pinpoint your biggest cost drivers, use the usage analysis tools within your Log Analytics workspace. By running queries, you can see which data types and which specific Kubernetes namespaces or pods are generating the most data. This analysis forms the foundation of your cost optimization strategy.
Fine-Tuning Data Collection with ConfigMaps
One of the most direct ways to control log analytics data ingestion is by customizing the Azure Monitor agent’s behavior. You can do this using a special Kubernetes ConfigMap. This file allows you to selectively enable or disable the collection of certain data types across your entire cluster.
Disabling Unnecessary Log Types
By default, the agent collects stdout logs, stderr logs, and environment variables from all containers. However, you might not need all of this data. For instance, if your developers primarily use stderr for actual errors, you could disable stdout logging for non-production environments.
Similarly, collecting environment variables from every single container can be redundant and add significant data volume. Disabling this can lead to immediate savings. You can modify the agent’s ConfigMap to turn off collection for stdout logs and environment variables, which can significantly reduce the amount of data ingested.
Filtering by Namespace
Your AKS cluster likely hosts a variety of workloads, from critical production applications to development and testing environments. It’s often unnecessary to collect detailed logs from non-critical namespaces. The ConfigMap allows you to exclude specific namespaces from data collection entirely. This is a powerful way to focus your monitoring budget on the services that matter most. For example, you can stop scraping logs from a dev or testing namespace while continuing to monitor production.
Implementing Data Collection Rules (DCRs)
For more granular control, you can use Data Collection Rules (DCRs). DCRs are a newer, more flexible way to define what data is collected and where it goes. They are the recommended method for configuring data collection for the Azure Monitor agent.
With DCRs, you can specify exactly which performance counters you want to collect and which logs to gather. This moves beyond the all-or-nothing approach of the ConfigMap. For example, instead of collecting all default performance metrics, you can create a DCR that only collects CPU and memory usage, ignoring disk or network metrics if they are less critical for your workloads.
Furthermore, DCRs allow you to send different types of data to different destinations. While this might not directly reduce ingestion volume, it can help you manage data more effectively, for instance by sending less critical logs to a cheaper storage solution.
Optimizing Your Log Analytics Workspace
Beyond controlling what data you send, you can also optimize how your Log Analytics workspace handles that data. These strategies focus on managing the data after it arrives.
Setting a Daily Cap
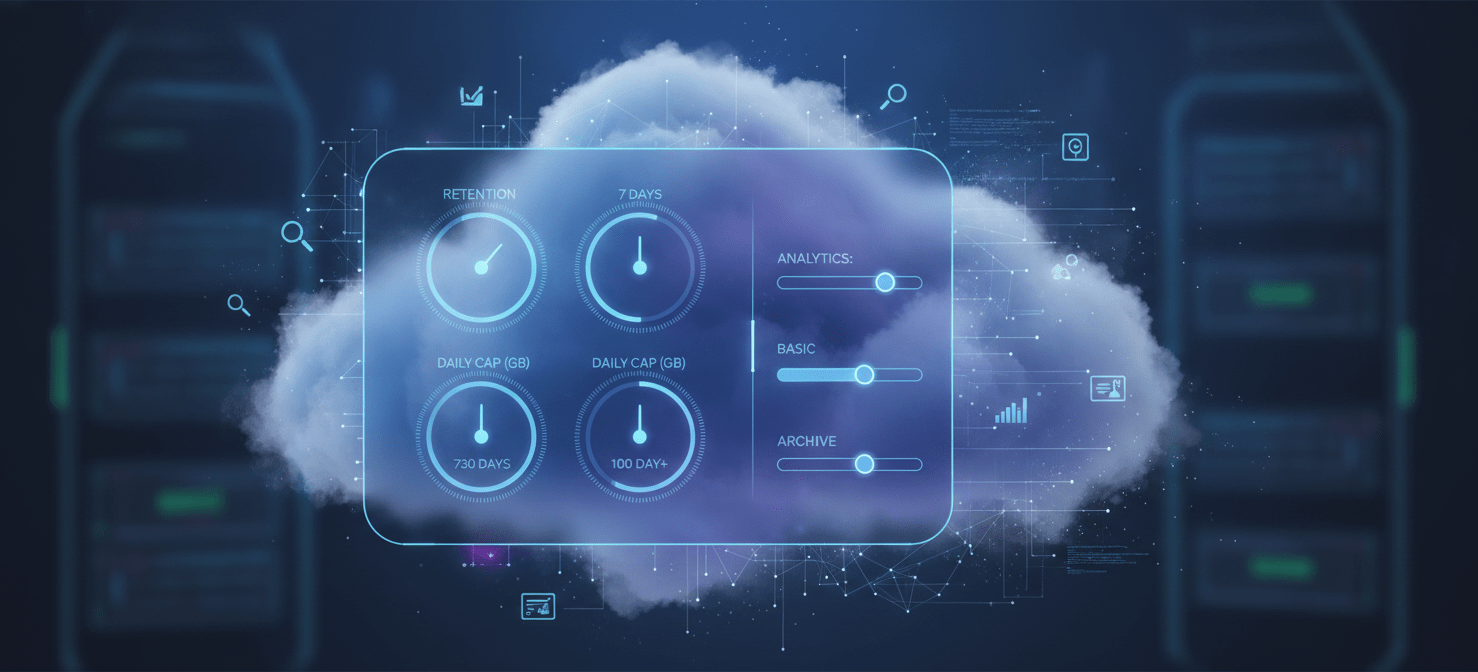
To prevent runaway costs, you can set a daily cap on the amount of data your Log Analytics workspace will ingest. According to Microsoft’s documentation, this feature stops data collection for the rest of the day once the limit is reached. This is a crucial safety net. While it means you might lose some data if there’s a sudden spike, it also ensures you won’t face a surprisingly large bill. It’s a trade-off between complete visibility and predictable costs.
Adjusting Data Retention
Log Analytics charges for data retention beyond a certain free period. Review your data retention policies. Do you really need to keep detailed performance logs for 90 days? Or is 30 days sufficient for your operational needs? Aligning your retention period with your actual business and compliance requirements can lower your storage costs over time.
Using Basic Logs
For verbose logs that you need for debugging but not for complex analytics or alerting, consider using Basic Logs. This is a lower-cost tier for ingesting and retaining certain types of logs. The trade-off is that you can’t use them for alerts and they have limited query capabilities. However, for high-volume, low-priority logs, this can be a very effective cost-saving measure.
Conclusion
Effectively managing your AKS log analytics costs is not about turning off monitoring; it’s about being intentional with the data you collect and retain. By starting with an analysis of your current data usage, you can make informed decisions. From there, using tools like ConfigMaps and Data Collection Rules allows you to fine-tune your data ingestion, capturing only what you truly need. Finally, workspace settings like daily caps and tiered storage provide a safety net and further optimization. There is no single magic bullet for high azure monitor aks cost. Instead, it requires a deliberate, multi-faceted approach. By implementing these strategies, you can strike the right balance between deep operational insight and a predictable, manageable cloud bill.
To further streamline your AKS cost management and gain deeper insights, you can explore a free Binadox trial, or if you prefer a direct conversation about your specific needs, it’s simple to arrange a personalized demonstration.
 7-day free trial