



Azure Reservations offer significant cost savings, but purchasing them is only half the battle. Without a clear strategy for monitoring their effectiveness, you risk underutilization and diminished returns. Effectively proving the value of these commitments to leadership requires a solid grasp of the available tools and reporting methods. This article provides a practical guide to azure reservation savings tracking, ensuring your cloud cost optimization efforts are both visible and impactful. You will learn how to navigate the Azure portal, calculate your return on investment, and communicate these financial wins across your organization.
Key takeaways
- Amortized vs. Actual Cost: Use the amortized cost view in Azure Cost Management to accurately distribute reservation costs over time and across the resources that use them.
- Utilization is Key: Regularly monitor reservation utilization percentages in the Azure portal; a consistently high percentage (ideally above 95%) is crucial for maximizing savings.
- Automate with Power BI: Connect Azure Cost Management to Power BI for automated, in-depth reporting and custom dashboards that can be shared with stakeholders.
- Start with Showback: Before implementing a full chargeback model, use showback reports to create visibility and build trust in your cost allocation data among different teams.
Why Tracking Azure Reservation Savings is Crucial
Simply put, you cannot manage what you do not measure. Azure Reservations represent a significant financial commitment—a promise to use specific resources for a one or three-year term in exchange for a discount of up to 72% compared to pay-as-you-go pricing. However, if the workloads you purchased the reservation for change, get decommissioned, or were incorrectly forecasted, that commitment turns into waste.
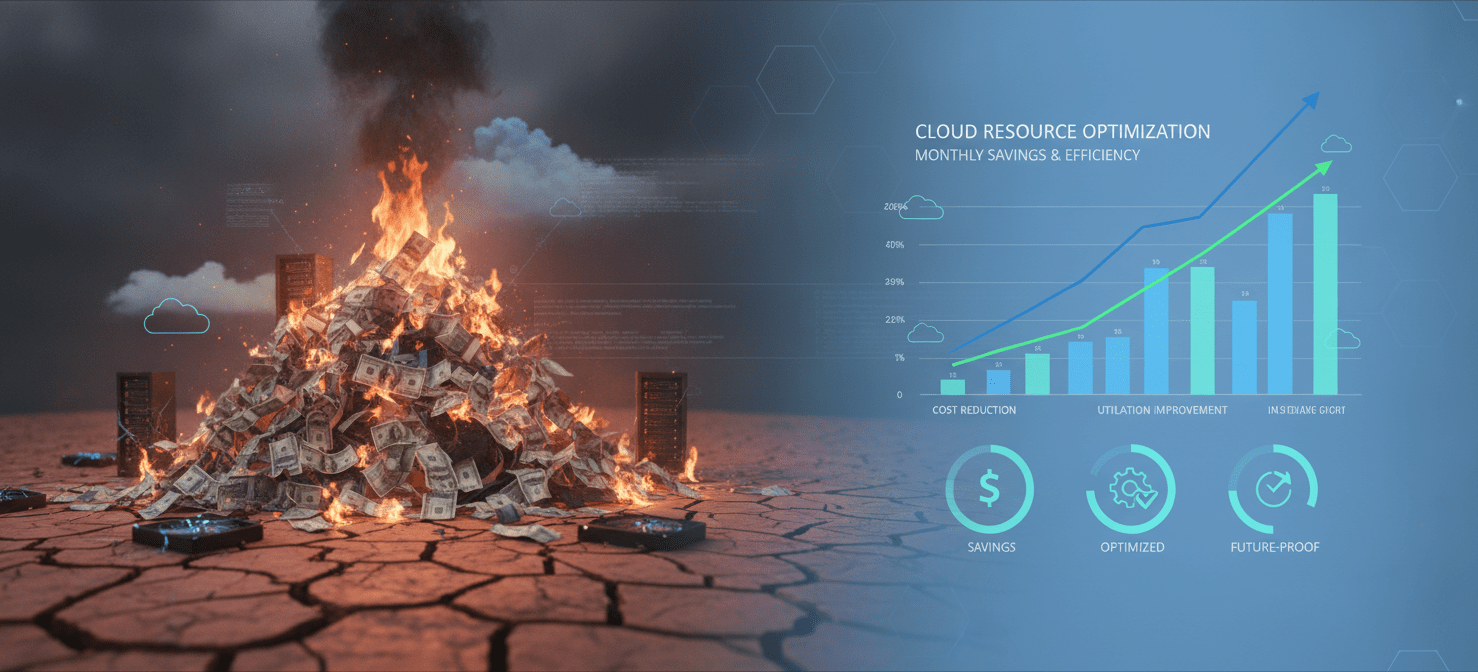
Effective tracking is essential for several reasons. First, it validates your initial purchase decision. By monitoring utilization, you can confirm that the reservation is being applied correctly and delivering the expected discount. Second, it allows for proactive optimization. If you spot an underutilized reservation, you can take action, such as changing the reservation’s scope or exchanging it for a different type that better fits your current needs. This agility is a core component of a successful FinOps practice.
Furthermore, consistent tracking provides the data needed to justify future cloud investments. When you can present clear reports showing money saved, you build credibility with finance and leadership teams. This data-driven approach transforms cloud cost management from a reactive expense-cutting exercise into a strategic financial practice.
How to Perform Azure Reservation Savings Tracking in the Portal
The Azure portal provides built-in tools designed to make tracking your Azure reserved instance savings straightforward. The primary location for this is within Azure Cost Management + Billing.
Finding and Interpreting Utilization Data
To begin, you need the correct permissions. Billing administrators, such as Enterprise Agreement (EA) admins, or users with specific RBAC access to the reservation can view the necessary data.
Here are the steps to find your utilization data:
- Sign in to the Azure portal.
- Navigate to Cost Management + Billing.
- In the left navigation menu, select Reservations.
This view provides a list of all your reservations. Each entry will display a utilization percentage, which shows how much of the reservation was used over a specific period. Clicking on a reservation’s utilization percentage will take you to a more detailed view, showing its usage trend over time. A healthy reservation should have a high utilization rate. Low utilization indicates that you are paying for capacity you are not using, effectively wasting money.
Using Amortized Costs for Accurate Reporting
When analyzing costs, it is crucial to switch from the “Actual Cost” view to the “Amortized Cost” view. The actual cost view shows the entire reservation purchase as a single lump sum on the day it was bought. This can create large spikes in your cost reports, making it difficult to understand monthly spending.
In contrast, the amortized cost view distributes the total cost of the reservation evenly over its entire term. For example, instead of a single $3,650 charge on January 1st for a one-year reservation, you will see a daily charge of $10. This view also allocates the prorated cost to the specific resources that consumed the reservation benefit, which is essential for accurate showback and chargeback. You can also see a charge type called “UnusedReservation,” which clearly identifies the cost of any underutilized capacity.
Calculating the ROI of Your Azure Reservations
Proving the value of your reservations requires more than just tracking utilization; you need to calculate the actual return on investment (ROI). This involves comparing what you spent on the reservation against what you would have spent on the same resources using the standard pay-as-you-go (PAYG) rates.
To calculate your Azure reservation ROI, follow this process within Azure Cost Management’s cost analysis tool:
- Get Reservation Costs: Using the amortized cost view, filter your data to show only the costs associated with a specific reservation. Summing these costs gives you the total amount you paid for the benefit (including both used and unused portions).
- Estimate PAYG Costs: To find what you would have spent without the reservation, you need to look at the usage data. For the usage that was covered by the reservation, multiply the
Quantityof usage by theUnitPriceto get the estimated PAYG cost. - Calculate Savings: Subtract the total reservation cost (from step 1) from the estimated PAYG cost (from step 2). The result is your total estimated savings for that period.
This calculation provides a clear, quantifiable metric demonstrating the financial benefit of your commitment. Regularly performing this analysis helps you build a business case for renewing existing reservations or purchasing new ones based on recommendations from tools like Azure Advisor.
Automating Savings Reports with Azure Cost Management
While manual checks in the portal are useful, automation is key to scaling your cost management efforts. Integrating Azure Cost Management with Power BI allows you to create powerful, automated, and shareable reports.
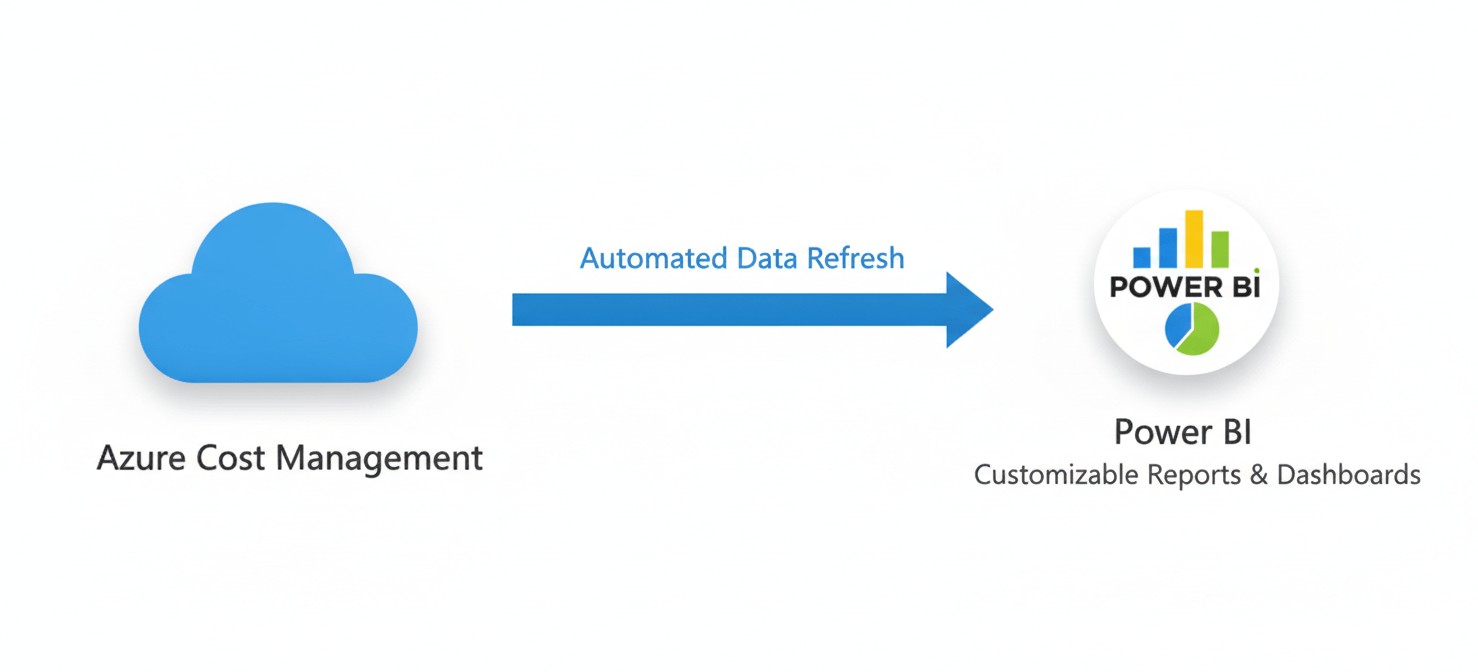
There are two primary ways to use Power BI for this purpose:
- The Cost Management Power BI App: Microsoft provides a pre-built Power BI app specifically for Azure Cost Management. For users with an Enterprise Agreement, this app offers a quick way to get started with pre-configured reports, including one for RI Savings.
- The Power BI Desktop Connector: For more customized and granular analysis, you can use the Azure Cost Management connector in Power BI Desktop. This allows you to pull raw usage and reservation data directly into your own Power BI model. You can then build custom visuals, merge data with other financial information, and create dashboards tailored to different audiences, from engineers to the CFO.
By setting up a scheduled data refresh in Power BI, you can ensure that stakeholders always have access to the latest savings information without any manual intervention. This level of automation frees up your team to focus on analysis and optimization rather than report generation.
Communicating Savings: Showback vs. Chargeback
Once you have the data, the final step is to communicate it effectively within your organization. This is typically done through a showback or chargeback model.
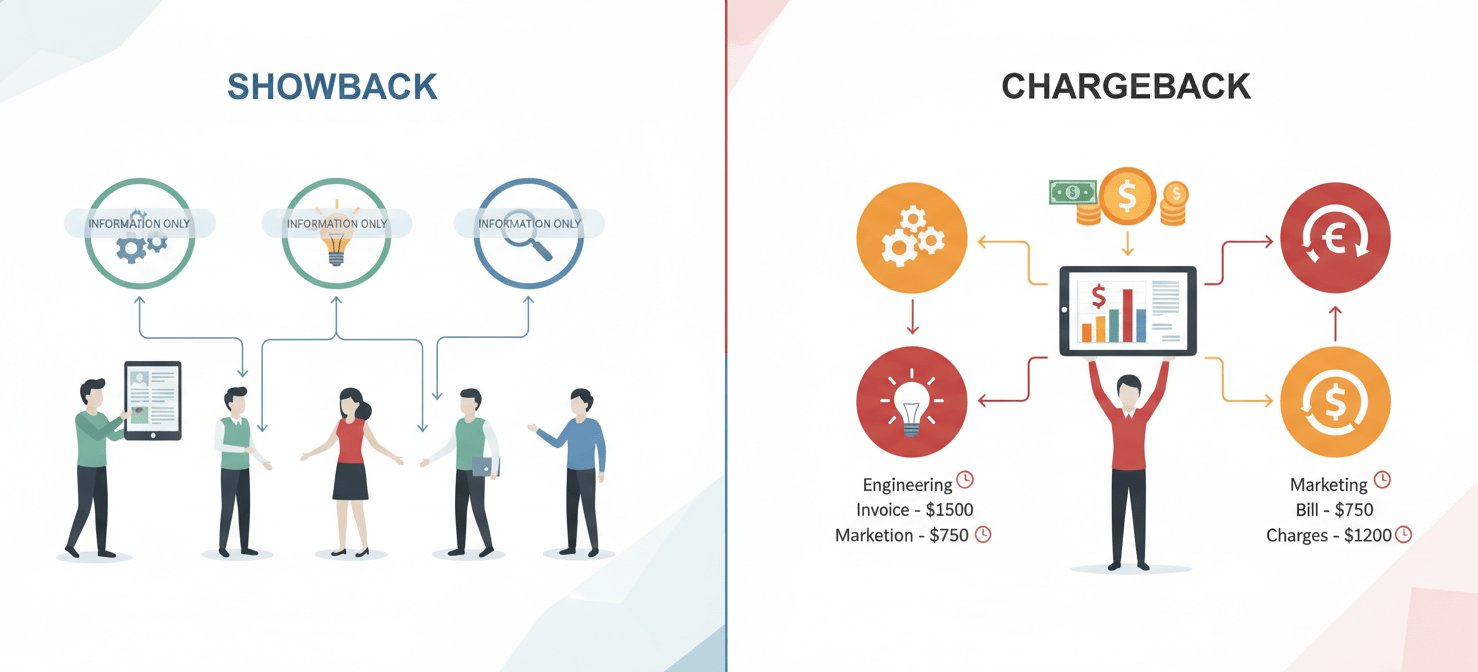
- Showback: This is an informational reporting model. You show different departments or teams what their Azure consumption costs are, including the savings generated from reservations, but you don’t actually bill them internally. Showback is an excellent starting point for building cost awareness and accountability. It allows teams to see the financial impact of their resource usage without the complexity of internal billing.
- Chargeback: This is a formal accounting process where the costs of cloud services are charged back to the budgets of the departments that consumed them. True chargeback requires a high degree of accuracy in your cost allocation model and often involves integration with your company’s financial systems. Using the amortized cost data from Azure is critical for fairly distributing reservation benefits in a chargeback model.
Most organizations begin with showback to build trust and refine their allocation methodology before moving to a full chargeback system. Both methods rely on the detailed, amortized data you can export from Azure Cost Management to prove that savings are being distributed fairly.
Conclusion
Ultimately, treating Azure Reservations as a “fire and forget” purchase is a recipe for wasted cloud spend. A disciplined approach to azure reservation savings tracking is not just an administrative task; it is a core FinOps competency. By regularly using the tools in the Azure portal, calculating your true ROI, automating reports, and clearly communicating the results through showback or chargeback, you can transform your reservation strategy from a simple discount mechanism into a proven and powerful engine for financial efficiency. The data is there for the taking—failing to use it is like leaving money on the table, and no one wants to explain that at the next budget meeting.
To truly master your Azure Reservation savings and avoid leaving money on the table, consider exploring a free trial of Binadox or arranging a personalized demonstration of its capabilities.
 7-day free trial