



Effectively analyzing cloud monitoring metrics is essential for maintaining the health, performance, and cost-efficiency of your AWS infrastructure. For services like EC2 instances and RDS databases, these metrics provide the raw data you need to understand resource utilization, identify bottlenecks, and prevent outages. Without a systematic approach, however, you can easily get lost in a sea of data points. This guide provides a practical framework for analyzing key performance indicators for your core compute and database resources.
Key takeaways
- Focus on the four pillars of monitoring for both EC2 and RDS: CPU, memory, storage, and network.
- For EC2, CPU Utilization is the primary metric; sustained usage above 80% often signals a need for scaling.
- In RDS, monitor
ReadIOPSandWriteIOPSto ensure your storage can handle the database workload. - Set up CloudWatch Alarms for key thresholds to automate responses and get notified before minor issues become major outages.
Understanding Key EC2 Instance Metrics
Amazon EC2 instances are the backbone of many cloud environments, making their performance critical. Monitoring them involves tracking metrics that reflect their computational health and efficiency. Therefore, a deep dive into these indicators is your first step.
CPU Metrics
CPU is the primary resource for any compute instance. For example, CPUUtilization is one of the most critical EC2 metrics. It shows the percentage of allocated EC2 compute units that are currently in use. A consistently high CPU utilization, such as sustained periods over 80%, often indicates that the instance is overworked. As a result, your application’s performance may degrade. You should investigate these spikes to determine if they are due to expected peak traffic or an underlying issue like inefficient code. Another related metric, CPUCreditBalance (for T-family instances), is also important. A declining credit balance suggests your instance may be throttled if it runs out of credits.
Memory and Disk Metrics
By default, AWS CloudWatch does not provide memory utilization metrics for EC2 instances. You must install the CloudWatch agent to collect this crucial data. High memory usage can lead to swapping, where the operating system uses disk space as a slow substitute for RAM, severely degrading performance. Therefore, monitoring memory is non-negotiable for production workloads.
For disk-related cloud monitoring metrics, focus on DiskReadOps, DiskWriteOps, DiskReadBytes, and DiskWriteBytes. These metrics help you understand the I/O patterns of your applications. For instance, a sudden, sharp increase in disk operations could signal a problem, such as a rogue process or an inefficient database query writing large temporary files. Consistently high disk I/O might also mean your EBS volume type is not sufficient for your workload, and you may need to provision a volume with higher IOPS.
Network Metrics
Network performance is another vital area. Key metrics include NetworkIn and NetworkOut, which track the volume of incoming and outgoing traffic in bytes. In addition, NetworkPacketsIn and NetworkPacketsOut can help diagnose network saturation or issues with packet loss. If NetworkOut is consistently hitting the instance’s network bandwidth limit, it’s a clear bottleneck. This can result in slow response times for users and failed connections between services.
How to Analyze Cloud Monitoring Metrics for RDS
Amazon RDS simplifies database management, but it doesn’t eliminate your responsibility for performance monitoring. Analyzing cloudwatch rds metrics ensures your database can handle your application’s load efficiently and reliably. These database-specific indicators provide a clear view of operational health.
Query Throughput and Latency
The core function of a database is to execute queries. Metrics like DatabaseConnections show how many client sessions are active. A sudden spike can indicate a connection leak in your application. Furthermore, Queries tracks the number of statements executed per second, giving you a sense of throughput. However, high throughput with high latency is not a good sign. ReadLatency and WriteLatency measure the average time for a read or write operation. Consistently high latency, for example, points directly to performance bottlenecks, which could be caused by unoptimized queries or insufficient hardware resources.
Storage and IOPS Metrics
For your RDS instance, storage performance is paramount. ReadIOPS and WriteIOPS represent the number of I/O operations per second. These should be monitored against the IOPS you have provisioned for your EBS volume. If you consistently exceed your provisioned IOPS, you’ll see a dramatic increase in latency as your operations get queued. This is reflected in the DiskQueueDepth metric, which AWS recommends keeping below a certain threshold depending on the workload. A high queue depth means your storage can’t keep up with the demand from the database.
Another critical metric is FreeStorageSpace. Running out of storage can cause your RDS instance to shut down to prevent data corruption. It is essential to set up a CloudWatch alarm to notify your team when free space drops below a safe threshold, such as 20%. This gives you ample time to provision more storage without service interruption.
CPU and Memory Utilization
Similar to EC2, CPUUtilization for RDS is a fundamental metric. A database server with sustained high CPU usage is often struggling with expensive queries. This could be due to missing indexes, poorly written SQL, or simply a workload that has outgrown its instance class.
Memory metrics are equally important. FreeableMemory shows how much RAM is available. When this number gets too low, the database may have to fetch data from disk instead of memory, which is significantly slower. SwapUsage indicates if the system is using disk-based swap space. Any significant swap usage is a strong signal that your RDS instance is under-provisioned for memory and needs to be scaled up.
Setting Up Alarms and Dashboards
Simply collecting metrics is not enough; you need to act on them. This is where CloudWatch Alarms and Dashboards become indispensable tools for proactive management. Instead of manually checking metrics, you can automate the process.
First, create a centralized CloudWatch Dashboard for each application or environment. This dashboard should display the most critical aws performance metrics for both your EC2 instances and RDS databases. For example, you can create widgets for EC2 CPU Utilization, RDS Read/Write Latency, and Free Storage Space. This provides at-a-glance visibility into the health of your system.
Next, configure CloudWatch Alarms for key operational thresholds. An alarm is a rule that watches a single metric over a specified time period and triggers an action if the metric’s value breaches a threshold. For example, you can set an alarm to trigger if an EC2 instance’s CPUUtilization exceeds 80% for 15 consecutive minutes. The action could be sending a notification to an Amazon SNS topic, which can then alert your team via email or Slack. For more advanced automation, you can configure an alarm to trigger an EC2 Auto Scaling action to add more instances. For RDS, a critical alarm would be on FreeStorageSpace to prevent your database from running out of disk.
Conclusion
Analyzing cloud monitoring metrics for EC2 and RDS is not a one-time task but an ongoing discipline. It requires understanding the key performance indicators for compute and database resources, from CPU and memory to I/O and network throughput. By establishing clear baselines, you can more easily spot anomalies that signal trouble. Furthermore, using tools like CloudWatch Dashboards for visualization and Alarms for automated notifications transforms monitoring from a reactive chore into a proactive strategy. Ultimately, a well-monitored system is more reliable and cost-effective. It fails less often, and when it does, you already have the data you need to understand why. Neglecting these metrics is like flying blind; you might be fine for a while, but you’re ignoring the turbulence ahead.
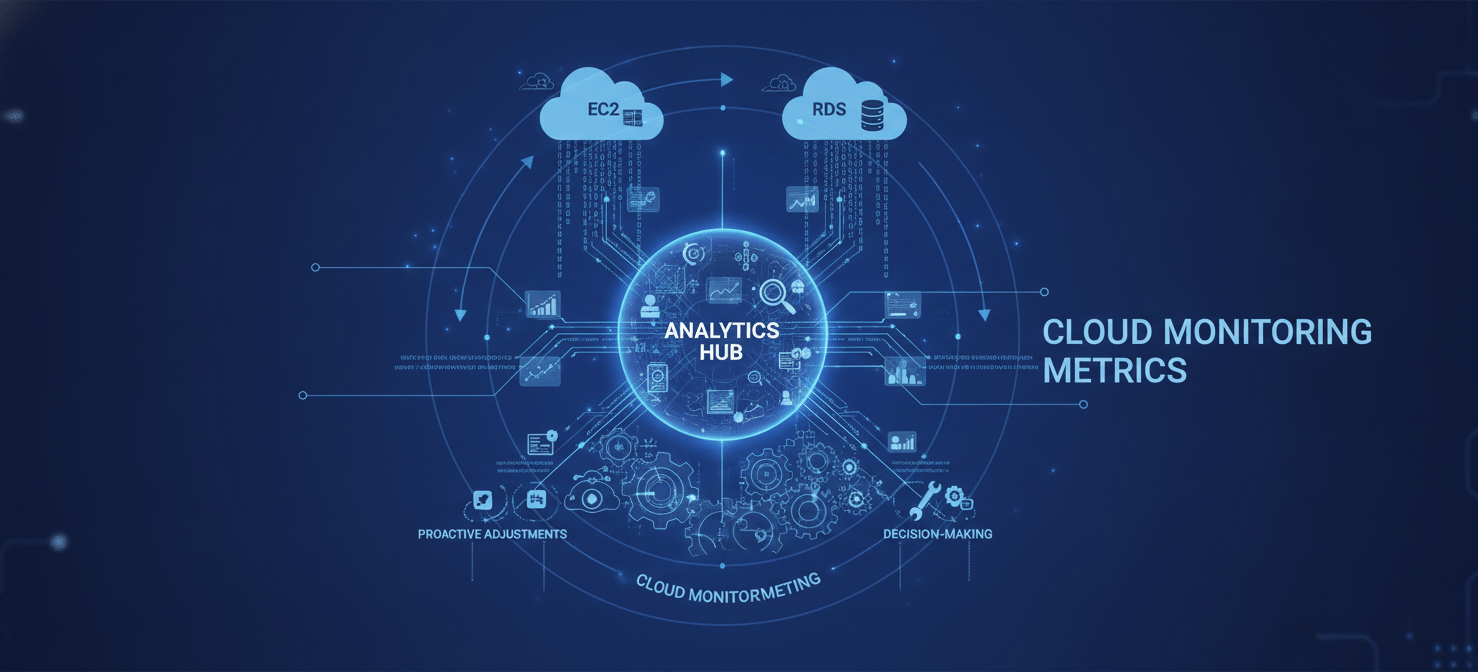
To transform your cloud monitoring from a reactive chore into a proactive strategy, you can experience Binadox through a free trial, or if you’d like a more personalized introduction, schedule a demonstration with our experts.
 7-day free trial