


Modern cloud environments are powerful and dynamic. But this complexity often makes spending difficult to track. As a result, many organizations treat their cloud bill like an uncontrollable utility expense rather than a strategic investment. True cloud cost visibility transforms these confusing expenditures into clear intelligence. It allows your teams to connect spending directly to specific products, teams, and business goals. Without this clarity, you risk accumulating systemic waste instead of generating value.
Key takeaways:
- Standard cloud billing reports are often not enough because they show what you spent, but not why.
- A top-down analysis is most effective. First, you should find high-level spending anomalies and then drill into raw data to find the specific cause.
- Generative AI and complex architectures have pushed estimated cloud waste to 29% of total spending, reversing years of optimization gains.
- Effective cost management in the cloud requires a repeatable workflow that combines rigorous data analysis, strong tagging policies, and automated tools.
Why Cloud Billing Reports Don’t Explain Every Charge
The first step toward understanding your spending is usually a native tool like AWS Cost Explorer or Azure Cost Management. However, many teams quickly find these reports are not enough to explain every charge. Native billing tools typically show aggregated, service-level totals. For example, you might see your total spend on Amazon EC2 or Amazon S3. This high-level view works for basic accounting but is disconnected from the daily work of your engineering teams.
When an invoice shows a sudden jump in compute costs, it tells you what changed but fails to explain why. The standard report does not know if a $47,000 cost spike was caused by a misconfigured gateway, an inefficient database query, a surge in customer traffic, or a new product feature. For instance, a major spending increase spread across several accounts could go unnoticed for a week. This delay can lead to huge financial overruns before anyone is even alerted.
Furthermore, traditional reports treat the cloud like a static, on-premises data center. But the cloud is completely dynamic. Infrastructure is provisioned through API calls, workloads scale automatically, and teams deploy code multiple times a day. Monthly or even weekly reporting is too slow to capture these rapid changes. As a result, the data is already disconnected from reality by the time it reaches the finance department. Treating cloud costs as a monthly accounting task instead of a continuous engineering discipline leads to a failure of accountability.
What You Can Learn from Cloud Billing Records
While high-level summaries are not enough, the raw billing records contain the detailed information needed for true cloud cost visibility. The AWS Cost and Usage Report (CUR) is a prime example, offering the most complete dataset on resource consumption and pricing. When you analyze these detailed records correctly, you can unlock deep insights into how your organization uses cloud services.
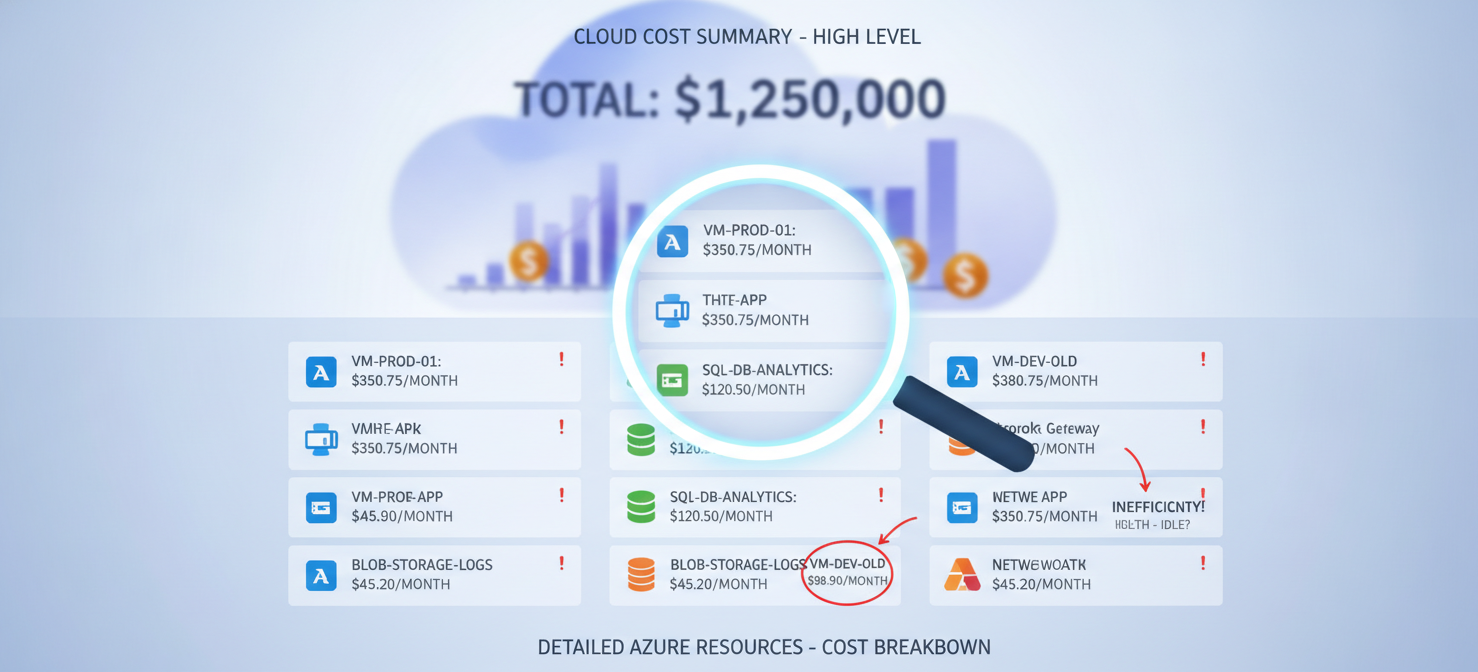
A single raw billing record contains dozens of important data points. Key information includes:
- Account Information: This identifies the specific cloud account that incurred the charge. Therefore, you can map costs to organizational units or environments like production or development.
- Service and Region: It specifies the exact cloud service (e.g., Amazon S3) and the geographic region where it was used. This is vital because pricing often varies by location.
- Usage Type and Operation: This defines the specific action that incurred a fee. For example, instead of a single “S3 charge,” the record separates storage costs from API request costs or data transfer fees.
- Pricing Information: This details the cost breakdown, showing how discounts, credits, or Reserved Instances were applied.
- Resource Identifiers (ResourceIDs): This captures the unique ID of the exact instance, database, or storage bucket that generated the charge. This level of detail is a major reason why billing records are so large.
By analyzing this data, your FinOps team can move beyond generic questions. Instead of asking “Why did database costs go up?” they can identify that a specific database replica in the us-east-1 region had a 400% increase in GetItem operations during a four-hour window. This granularity is essential for finding inefficiencies and enforcing accountability.
Start with Aggregated Costs to Locate Spending Anomalies
Because raw billing records are so large, analyzing them from the bottom up is not efficient. Instead, an effective workflow for cloud cost management begins at the top. Analysts must start with aggregated costs to establish a baseline of normal spending before trying to find anomalies.
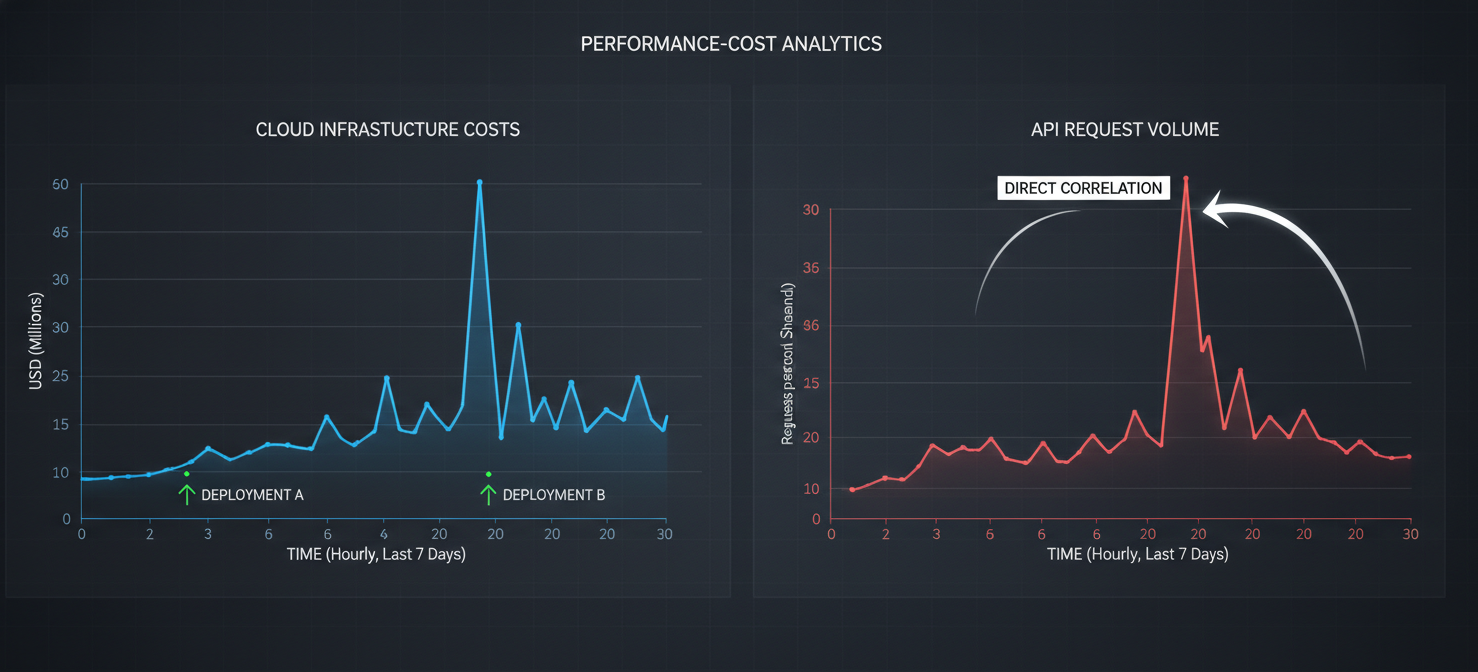
The first step is to plot your monthly or weekly cloud spending trend. This high-level view immediately answers basic questions for leadership. Is total cloud spend growing or declining? If it is growing, when did that trend begin? This macroscopic view helps you visually identify major shifts in spending that might be hidden in a million-row spreadsheet.
Once you detect a high-level anomaly, such as a 22% quarter-over-quarter increase, you can systematically drill down. You can begin by grouping the spending by different dimensions, like linked accounts or top-level services. For example, if your dashboard shows that costs spiked on the 14th of the month, you can investigate further. If filtering by service reveals that 90% of that spike came from Amazon EC2 instances in a single development account, you have immediately narrowed the investigation.
Modern cloud cost intelligence tools automate this top-down approach. They continuously track usage trends over time to build historical baselines. Then, these systems automatically flag unexpected spikes, such as sudden increases in data transfer costs or misconfigured scaling policies that leave instances running over a weekend. Starting with these aggregated alerts prevents your team from wasting hours hunting through raw data without a clear direction.
Break Down Cloud Expenses by Kind of Usage
After you locate the general source of an anomaly, the next step is to break down expenses by the specific kind of usage. Cloud billing is complex because a single service can generate costs in different functional categories. Generally, cloud usage can be broken down into core types: Compute, Storage, Networking, and Specialized Services like AI or managed databases.
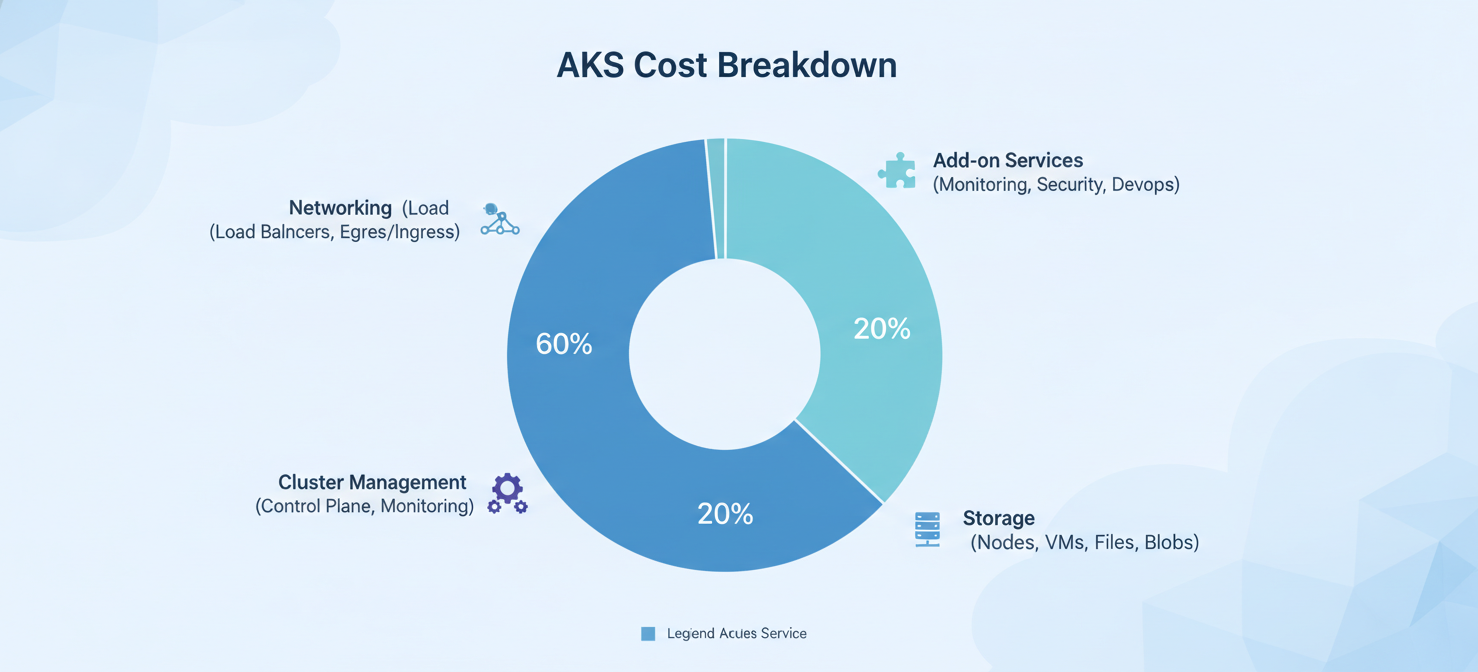
Understanding how different usage types contribute to the bill is essential for optimization. For instance, a team might see their Amazon S3 bill steadily increasing. Without a breakdown, they might assume they are just storing more data and start deleting old files. However, a breakdown by usage type might show that storage costs are flat, but DataTransfer-Out costs have soared. This could be because an external application is repeatedly downloading a full dataset instead of only the changes.
The Impact of AI on Usage Categories
This dynamic is becoming more serious with the rapid adoption of artificial intelligence. According to the Flexera 2026 State of the Cloud Report, 58% of organizations now run generative AI as a public cloud service. AI introduces entirely new usage metrics that do not fit traditional models. For example, AI services bill based on variables like token throughput, API requests, and GPU inference time. These workloads are highly dynamic and experimental. Teams often spin up expensive GPU instances for tests and then abandon the resources. Therefore, breaking down AI-specific usage is critical for maintaining cost control.
Breaking down usage also enables cloud unit economics. This practice involves measuring the cost-effectiveness of infrastructure based on business metrics, such as cost per customer or cost per transaction. By changing the conversation from “We spent $10,000 on compute” to “Our compute cost per active user is $0.05,” your organization can determine if rising costs are a sign of inefficiency or healthy business growth.
Trace Unexpected Costs Through Raw Billing Data
When high-level dashboards point to an issue, the final step is to trace the unexpected costs through the raw billing data. Dashboards summarize data, but they often hide the deepest technical details. To achieve complete cloud cost visibility, you must interact with the raw data itself.
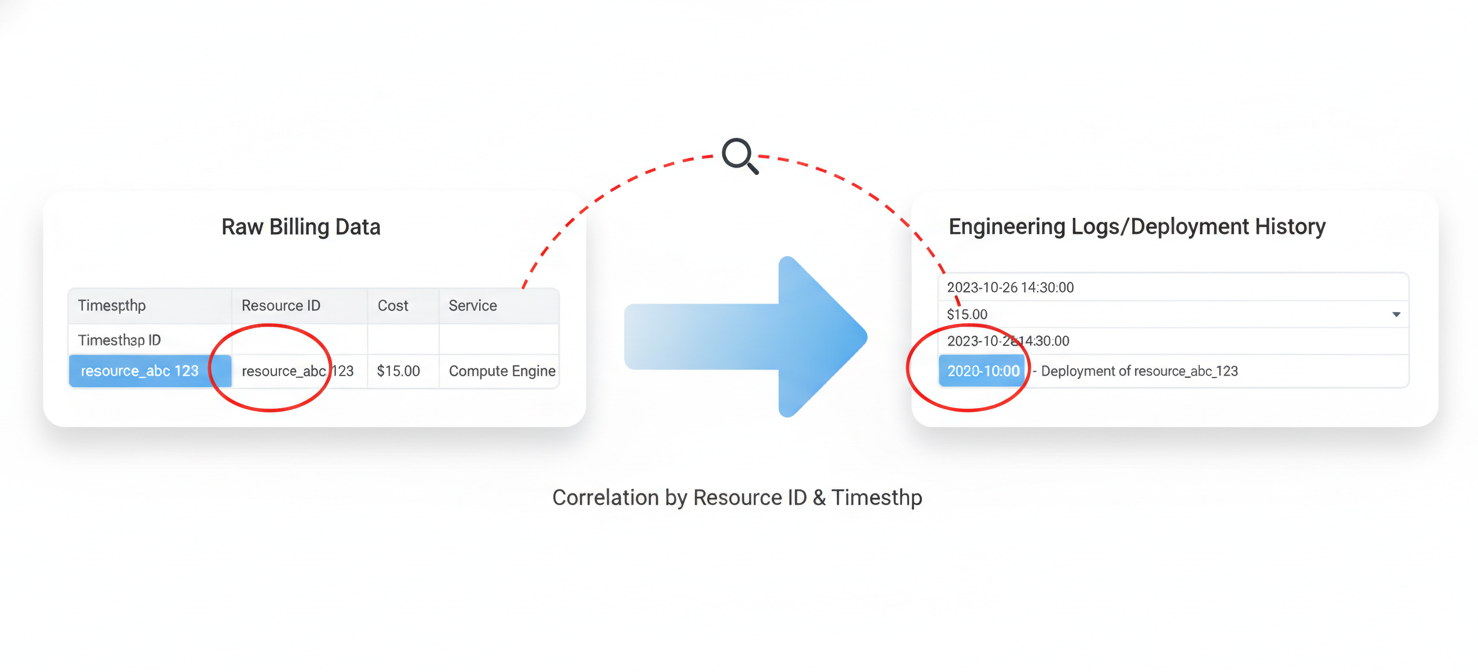
The AWS Cost and Usage Report (CUR) creates a new row for every unique combination of service, usage type, and operation on an hourly basis. To trace an unexpected cost, you need to filter these millions of rows to isolate the specific hours when the spike began. Next, you must examine the ResourceID column. This column identifies the exact asset, like an EC2 instance ID, that generated the charge.
Once you identify the precise resource, you must connect the cost signal back to the engineering context. The raw billing data is separate from your application logs. Therefore, analysts must correlate the timestamp of the billing spike with internal engineering logs, such as deployment histories or infrastructure-as-code changes. For example, if raw data shows a massive spike in data transfer starting at 14:00 UTC, and engineering logs show a new microservice was deployed at 13:45 UTC, the cost is definitively traced to that deployment. Linking financial data to engineering actions turns an abstract billing problem into an actionable engineering task.
Use Filters to Isolate Specific Resources, Services, and Charges
Managing the huge volume of cloud billing data is impossible without a good system of metadata. To effectively analyze and manage cloud cost, your organization must use filters to isolate specific resources and charges. This is primarily achieved through a rigorous tagging strategy.
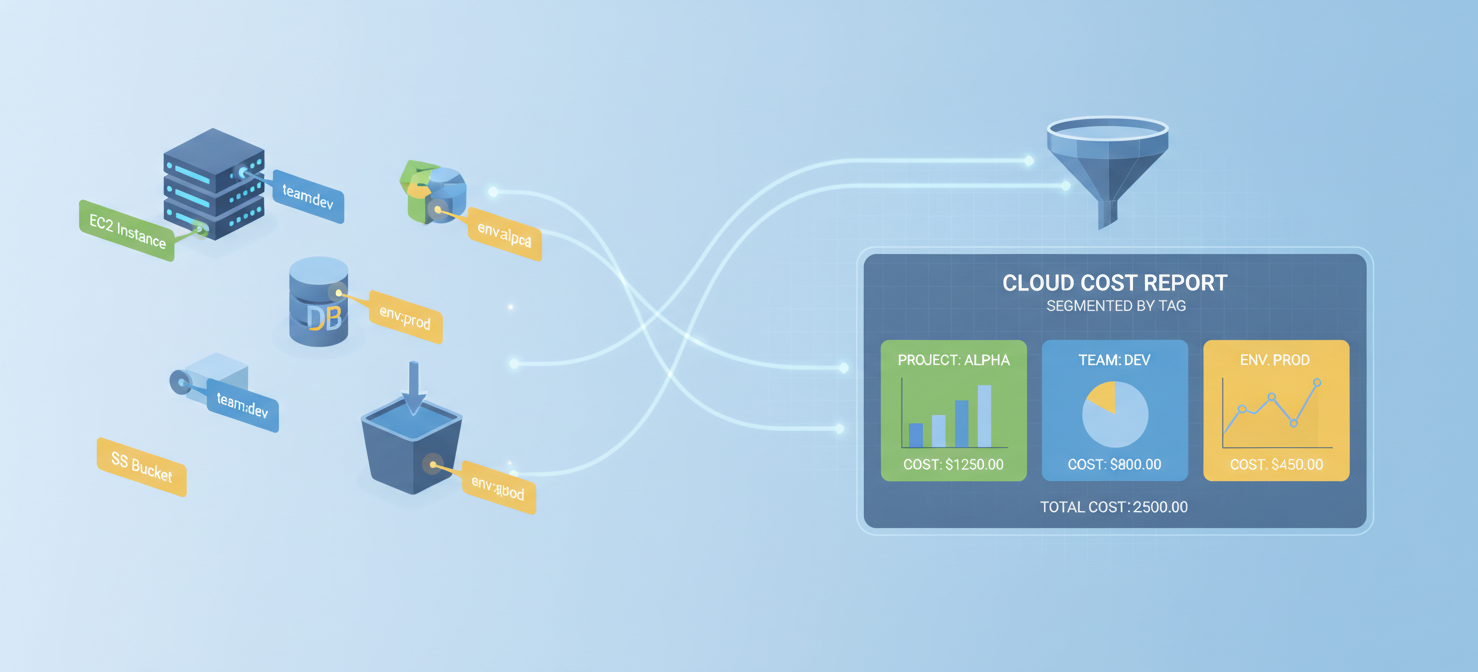
Cost allocation and attribution are the core mechanics of visibility. Allocation is the process of assigning costs to their owners. Every dollar spent should trace back to a responsible team, product, or business unit. This requires engineers to apply standardized tags (e.g., Owner: DataScience, Project: RecommendationEngine) to every resource they create. With proper tagging, a finance analyst can apply a simple filter to see exactly how much the “Recommendation Engine” project costs across all services.
However, maintaining these filters at scale is difficult. A tagging strategy that works for a small startup can easily fail as an enterprise grows to hundreds of services. Resources are often left untagged, or typos in tag keys break automated filters. Without strict enforcement of tagging policies at the deployment pipeline, cost optimization lacks accountability. When an invoice increases by $50,000 on untagged resources, leadership has no way of knowing which team is responsible. Therefore, defining clear tagging policies and enforcing them programmatically are mandatory steps.
Connect Usage Categories with Individual Billing Records
While tagging solves cost allocation for dedicated resources, it does not solve the problem of shared infrastructure. One of the most complex parts of analyzing cloud spending is attribution, which is the process of assigning shared costs to the specific workloads that use them.
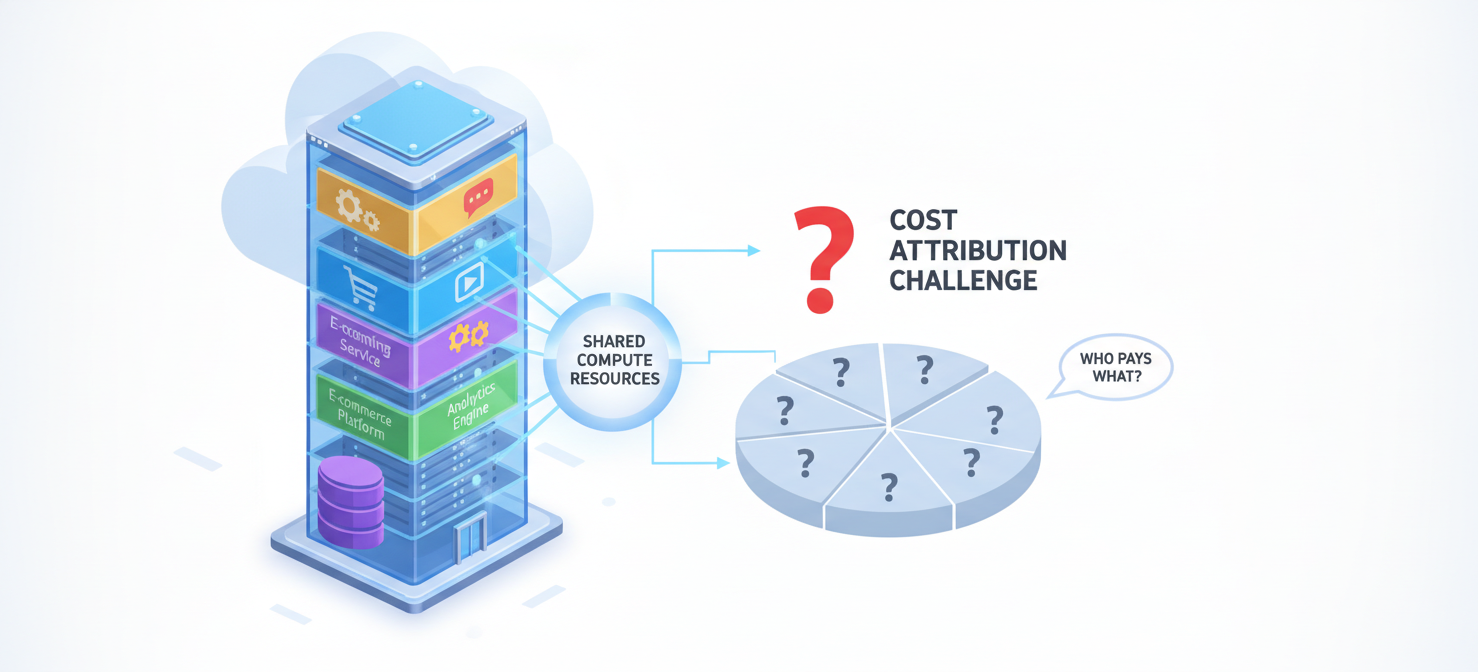
In modern architectures, resources are rarely isolated. A single Kubernetes cluster might host five different microservices owned by three separate teams. A large, centralized database might support ten different applications. Native billing records only show the total cost for the underlying cluster instances or the database. The cloud provider cannot see how your application’s internal logic divides that usage.
To connect usage categories with individual billing records, you must overlay your internal application data onto the cloud provider’s invoice. For Kubernetes, this involves deploying agents that monitor CPU and memory consumption at the pod level. By calculating the percentage of cluster resources a specific microservice uses, FinOps tools can proportionally divide the underlying EC2 costs and attribute them to the correct teams. This capability is critical. The 2026 Flexera report notes that hybrid and multi-cloud architectures rely heavily on containerization, making shared cost attribution a mandatory requirement for accurate financial forecasting.
Export Cloud Billing Data for Custom Analysis and Reporting
The massive scale of billing data forces organizations to move beyond browser-based dashboards. Instead, you must export your cloud billing data for custom analysis. As an organization grows, an hourly AWS Cost and Usage Report (CUR) can easily contain millions of rows per month.
Desktop spreadsheet applications like Microsoft Excel have a hard limit of 1,048,576 rows. Similarly, Google Sheets will crash when trying to process datasets of this size. As a result, when a report is too large, cloud providers like AWS automatically split it into multiple files.
To overcome these limits, enterprises export billing data into compressed, column-oriented formats like Apache Parquet or CSV.gz. These formats are designed for massive scale and allow for rapid querying. The standard workflow involves configuring your cloud provider to deliver these raw billing exports to a cloud storage repository, like an Amazon S3 bucket, on a daily or hourly basis.
Once the data is in a central data lake, you can use big data query engines like Amazon Athena or next-generation analytical spreadsheets like Row Zero to work with it. Using SQL queries or AI-assisted prompts, your FinOps team can merge months of billing data, join it with internal project management databases, and build custom, interactive dashboards that refresh automatically.
Investigate Cost Spikes and Unusual Billing Patterns
Even with good data pipelines, the main goal of this work is to investigate cost spikes and eliminate waste. This task has become critically urgent. According to an analysis of the Flexera 2026 State of the Cloud Report, an estimated 29% of all cloud infrastructure spend is wasted.
This 29% waste figure represents a staggering financial loss. It equates to roughly $182 billion to over $195 billion wasted globally each year. Furthermore, the Flexera data shows that organizations are exceeding their public cloud budgets by an average of 17%.
| Year | Estimated Cloud Waste | Context / Trend |
|---|---|---|
| 2022 | 32% | Peak waste during rapid pandemic-era migrations. |
| 2023 | 28% | Improvement due to initial FinOps adoption. |
| 2024 | 27% | Steady state of optimization. |
| 2025 | 27% | Maintained optimization baseline. |
| 2026 | 29% | Reversal of 5-year trend; massive spike due to GenAI. |
The primary driver for this reversal is the rapid integration of Generative AI. AI workloads consume huge amounts of specialized compute resources and bill through unpredictable metrics like token counts. Because AI adoption is moving faster than governance frameworks, engineering teams are spinning up expensive experiments and abandoning idle GPU fleets that operate at low utilization.
Investigating these unusual billing patterns requires a shift from reactive monthly audits to proactive anomaly detection. When an investigation uncovers a spike, analysts must classify it. Is it a true anomaly, like a developer leaving an expensive GPU instance running over the weekend? Or is it a structural inefficiency, where the architecture is fundamentally over-provisioned? Discovering these patterns allows organizations to implement automated guardrails, right-size instances, and purchase commitment discounts to structurally reduce spending.
Build a Repeatable Workflow for Cloud Charge Investigation with Binadox
Manual investigation of billing records is not scalable for large operations. To achieve sustainable cloud cost visibility, you need to implement dedicated FinOps platforms that build repeatable, automated workflows. One such platform is Binadox, which provides a unified approach to both multi-cloud and SaaS spend optimization.
Binadox centralizes data from major cloud providers—including AWS, Microsoft Azure, and Google Cloud—into a single dashboard. This multi-cloud capability is crucial, as the Flexera 2026 report notes that 73% of organizations now operate in hybrid or multi-cloud environments. By integrating these different environments, Binadox removes the need for analysts to manually download and reconcile separate billing reports.
To support continuous investigation, Binadox offers a specific suite of tools:
- Multi-Cloud Cost Explorer: Provides real-time analytics to track spending trends and isolate usage with custom tags.
- Automated Rightsizing: The platform continuously monitors usage patterns to automatically detect idle or overprovisioned assets, directly addressing the 29% cloud waste factor.
- Context-Driven Anomaly Detection: Binadox allows teams to set automated budgets that trigger instant alerts when abnormal spending occurs. This moves your team from a reactive monthly review to real-time financial control.
- LLM & IaC Cost Optimization: The platform includes specialized tracking to monitor and optimize large language model (LLM) expenses, ensuring that AI experimentation does not silently drain your budget.
- Unified SaaS Spend Management: Beyond infrastructure, Binadox also identifies “Shadow IT” by tracking software subscriptions and identifying abandoned licenses.
Binadox uses a transparent, subscription-based pricing model for different scales:
| Binadox Tier | Monthly Cost | Key Features & Limits |
|---|---|---|
| Starter | $99 | Full platform features, multi-cloud explorer, basic SaaS renewals. Limits: 3 Cloud Accounts, 5 SaaS Apps, 3 Seats. |
| Professional | $299 | Adds chargeback and showback features. Limits: 10 Cloud Accounts, 20 SaaS Apps, 10 Seats. |
| Premium | $499 | Unlimited Cloud Accounts, Unlimited SaaS Apps, Unlimited Team Seats, Advanced automated controls. |
By using platforms like Binadox, organizations can shift the burden of data processing away from manual spreadsheet work and toward strategic, automated decision-making.
Conclusion: Turn Cloud Billing Records into Actionable Cost Insights
The discipline of analyzing cloud spending has changed how technology investments are managed. Complete cloud cost visibility is no longer just an accounting task. It is a vital operational requirement for ensuring the financial health of your digital business. As the 2026 state of the industry shows, the explosive growth of generative AI has made it easier than ever to waste staggering amounts of money—up to 29% of your total infrastructure spend.
By acknowledging that standard billing reports do not explain every charge, you can move to a more sophisticated FinOps model. This involves working with granular data sets like the AWS Cost and Usage Report, using strict tagging policies, and attributing shared resource costs. Through big data pipelines and centralized platforms like Binadox, companies can establish automated workflows that catch anomalies the hour they occur, not weeks after the bill is paid.
Ultimately, turning raw cloud billing records into actionable intelligence ensures predictable spending. It establishes firm financial control. And it empowers your engineering teams to build scalable, high-performance systems without sacrificing economic efficiency.
To achieve predictable spending and empower your teams with true economic efficiency, you can explore the platform’s capabilities by starting a free trial or arrange a personalized demonstration.
 7-day free trial