



As a FinOps lead or cost analyst, you know that visibility is the bedrock of cost management. Yet, Amazon CloudWatch, a service designed to provide visibility, can ironically become a significant and opaque line item on your AWS bill. Unchecked, its costs for logs, metrics, and alarms can quietly spiral, undermining your budget forecasts and cost allocation efforts. Effectively managing this spend requires more than just a cursory glance at the monthly invoice; it demands dedicated finops cloud cost tools and a strategic approach to turn raw monitoring data into actionable financial insights. This article breaks down the native and third-party tools that empower your team to dissect, attribute, and optimize every dollar of CloudWatch spend.
Key takeaways
- Default settings are costly: CloudWatch log groups retain data indefinitely by default, a primary driver of runaway storage costs. Implementing a 30-day retention policy can cut spend significantly.
- Cost allocation is critical: Without meticulous tagging, attributing CloudWatch costs to specific teams, projects, or applications is nearly impossible. Activating user-defined cost allocation tags is a foundational step.
- Native tools provide a starting point: AWS Cost Explorer and Cost and Usage Reports (CUR) are essential for initial analysis, but they often require significant effort to yield granular, actionable insights for showback or chargeback.
- Third-party solutions offer deeper automation: Specialized cloud finops solutions can automate cost allocation, identify optimization opportunities beyond native tools, and integrate spend data into a unified view for engineering and finance.
The Challenge of Unchecked CloudWatch Spend
CloudWatch pricing is multifaceted, with costs stemming from three main pillars: data ingestion, data storage, and data analysis. Each pillar has its own pricing metrics—per GB for ingestion, per GB-month for storage, and per metric or alarm for monitoring. This complexity makes it difficult to build accurate forecasts and even harder to explain cost variances to stakeholders. Without a clear strategy, you’re left with a bill that’s hard to attribute and even harder to control.
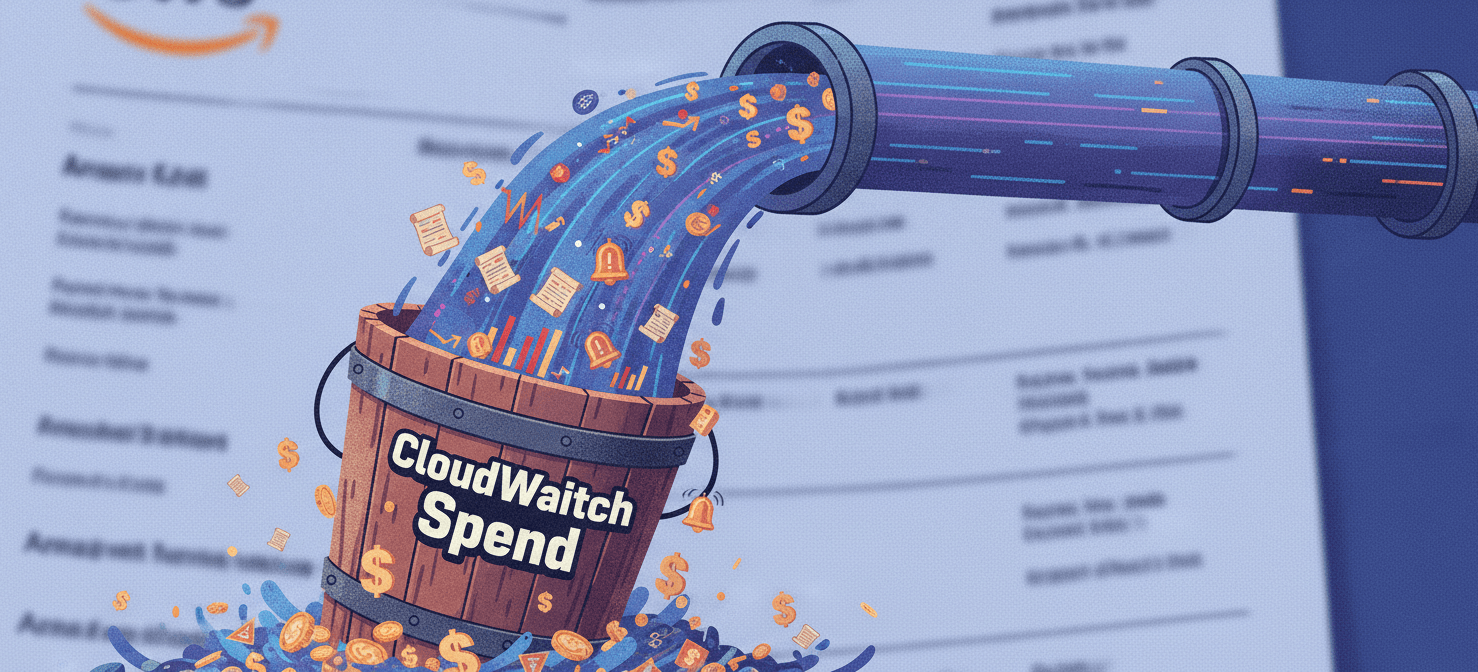
The core of the problem lies in a few common areas:
- Verbose Logging: Development teams often leave
DEBUGorINFOlevel logging enabled in production, leading to massive data ingestion volumes. Data ingestion is frequently the single largest driver of high CloudWatch bills. - Infinite Log Retention: The default setting to store logs forever is a silent budget killer. Without explicit retention policies, storage costs for non-critical logs will grow month over month.
- High-Cardinality Custom Metrics: Every unique combination of a metric name and its dimensions creates a new custom metric, each with a monthly cost. A poorly designed metric strategy can result in thousands of unnecessary metrics. For the first 10,000 metrics, the cost is $0.30 per metric per month.
- Lack of Ownership: When engineering teams aren’t aware of the cost implications of their monitoring configurations, there’s no incentive to be efficient. This is where robust showback or chargeback models become essential.
Without proper tools and processes, these issues lead directly to budget overruns and an inability to accurately attribute costs, undermining key FinOps KPIs like cost allocation coverage and forecast accuracy.
Native AWS FinOps Cloud Cost Tools for CloudWatch
AWS provides a suite of tools that serve as the foundation for any CloudWatch cost management strategy. While they may not offer the turnkey dashboards of third-party platforms, they are the source of truth for all cost and usage data.
AWS Cost and Usage Report (CUR) and AWS Cost Explorer
Your first step in analyzing CloudWatch spend is to use AWS’s core billing tools.
- AWS Cost Explorer: This is your primary interface for visualizing spend. You can filter specifically by the CloudWatch service to see high-level trends over time. Furthermore, you can group costs by usage type (e.g.,
DataProcessing-Bytes,MetricMonitorUsage,VendedLogs) to understand which components are driving your bill. This helps you identify if your primary cost driver is log ingestion, custom metrics, or something else. - AWS Cost and Usage Report (CUR): For more granular analysis, the CUR is indispensable. This report provides the most detailed data available, delivering hourly or daily line items for every unique combination of product, usage type, and operation to an S3 bucket. By loading your CUR data into Amazon Athena, you can run complex SQL queries to pinpoint specific high-volume log groups or costly metric namespaces, a task that is difficult in Cost Explorer alone.
Cost Allocation Tags
Visibility without accountability is insufficient. Cost allocation tags are the primary mechanism for attributing CloudWatch costs back to the teams or projects that incurred them.
- Tagging Strategy: A consistent tagging policy is non-negotiable. Define mandatory tags such as
CostCenter,Project, orOwnerfor all resources that generate logs or metrics. - Activation: Crucially, a tag must be activated as a “Cost Allocation Tag” in the AWS Billing and Cost Management console before it will appear in your Cost Explorer or CUR data. This is a frequently missed step that prevents cost attribution.
- Automation: Relying on engineers to manually tag everything is a recipe for failure. Use AWS Organizations and Service Control Policies (SCPs) to enforce tagging at resource creation. Additionally, AWS-generated tags, like
aws:cloudformation:stack-name, can provide a baseline of attribution without manual effort.
AWS Budgets and CloudWatch Alarms
Proactive monitoring of your monitoring spend is a key FinOps practice.
- AWS Budgets: Create a specific budget for your CloudWatch service costs. You can configure alerts to notify your team via email or Slack when actual or forecasted spend exceeds your defined threshold. This acts as an early warning system, preventing month-end surprises.
- Billing Alarms: For more immediate notifications, you can create a CloudWatch alarm that monitors your total estimated AWS charges. While not specific to CloudWatch spend, it’s a critical backstop to catch any anomalous spike in overall costs.
These native aws cost management tools provide the raw data and basic controls. However, translating this data into a clear, consistently updated chargeback dashboard that engineering teams can understand and act upon often requires significant manual effort or the adoption of more specialized solutions.
Third-Party Cloud FinOps Solutions for Deeper Insights
While native tools are powerful, they often require a heavy lift from a data engineering or analytics perspective to build and maintain the sophisticated dashboards needed for effective FinOps. Third-party finops cloud cost tools are designed to bridge this gap, offering specialized features for cost allocation, optimization, and stakeholder reporting.
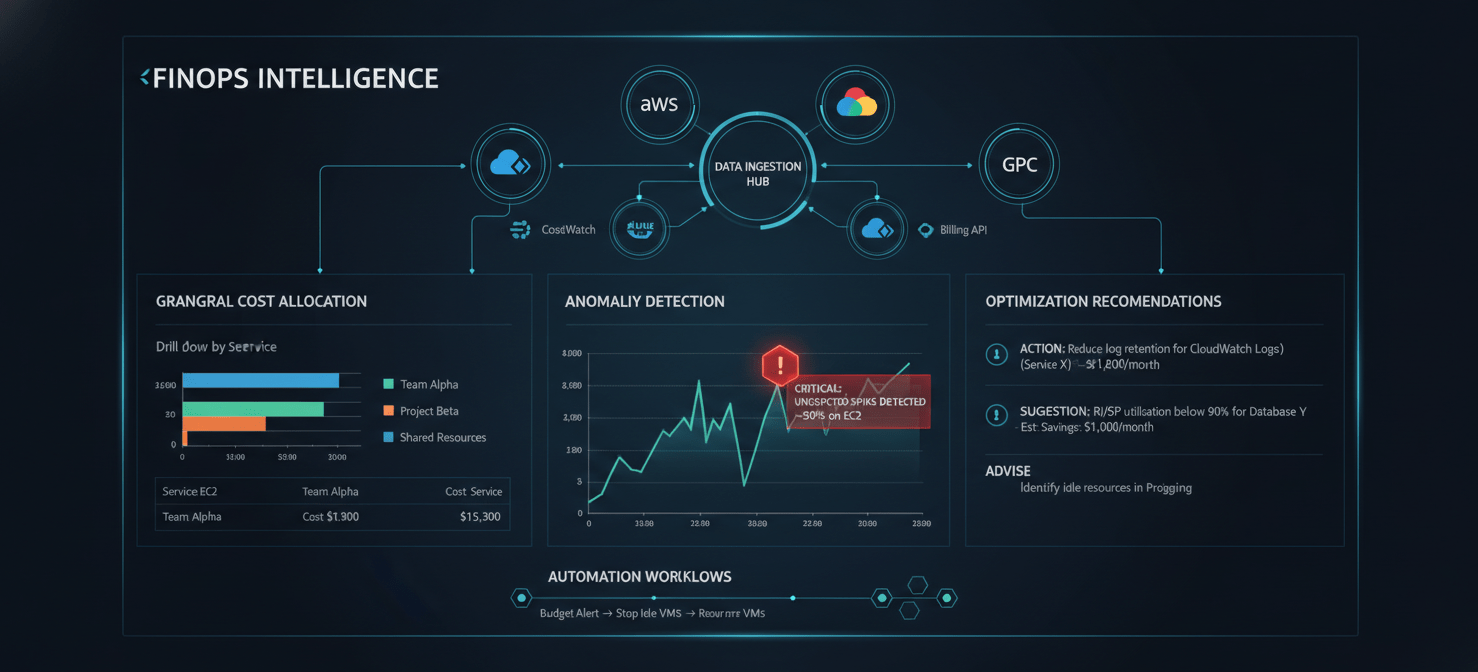
These platforms typically ingest your CUR data and enrich it to provide a more intuitive and actionable view of your cloud spend. For a FinOps analyst focused on CloudWatch, their value lies in several key areas:
Granular Cost Allocation and Showback
Many third-party tools excel at untangling shared costs and providing clear showback and chargeback dashboards. Platforms like Finout, CloudZero, and Ternary can unify cost data from multiple sources (not just AWS) into a single, coherent view. They can help you:
- Attribute Untaggable Costs: Allocate costs from services that are difficult to tag, like data transfer, based on the usage patterns of tagged resources.
- Visualize by Business Context: Create dashboards that present CloudWatch costs not just by AWS account or service, but by team, product feature, or customer. This reframes the conversation with engineers from “CloudWatch costs are high” to “Your new feature’s logging is costing us $X per day.”
- Automate Reporting: Schedule and distribute customized cost reports to budget owners, eliminating the manual effort of building and sending spreadsheets.
Anomaly Detection and Waste Identification
Beyond basic budget alerts, specialized cloud finops solutions use machine learning to detect cost anomalies and identify specific sources of waste. For CloudWatch, this could mean automatically flagging:
- A sudden spike in log ingestion from a single application, indicating a potential misconfiguration.
- The creation of thousands of new custom metrics after a recent deployment.
- Log groups with high storage costs and no configured retention policy.
Tools like Anodot and Vantage provide advanced anomaly detection and automated waste cleanup, moving beyond mere recommendations to active remediation.
Integrated Optimization Recommendations
While AWS Trusted Advisor and Compute Optimizer offer recommendations, third-party platforms often provide a more holistic view that connects observability data with cost data. For example, a platform might analyze log patterns and recommend moving verbose, infrequently accessed logs to a cheaper storage tier like S3 or the CloudWatch Logs Infrequent Access class, which can cut ingestion costs by 50%. This connects an operational decision directly to a financial outcome, which is the core of the FinOps mission.
Choosing the right tool depends on your organization’s maturity and specific needs. Some platforms focus heavily on Kubernetes cost allocation, while others excel at managing AWS savings instruments. The key is to find a solution that integrates seamlessly with your existing workflows and provides the specific CloudWatch insights your team needs to drive accountability.
Building a FinOps Culture Around CloudWatch Monitoring
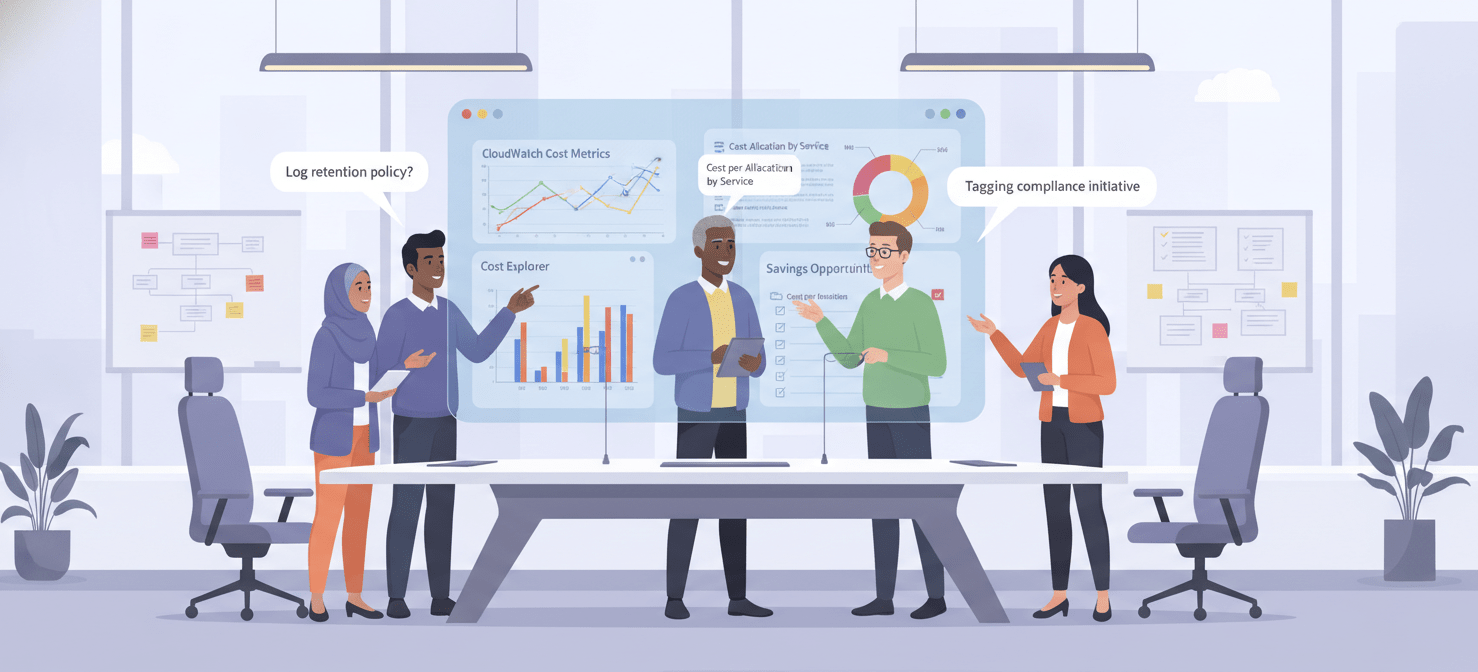
Tools are only one part of the equation. Lasting control over CloudWatch spend comes from embedding cost-awareness into your engineering culture. As a FinOps analyst, your role is to facilitate this cultural shift by providing engineers with the right data and incentives.
Establish Clear Guardrails
Work with engineering leadership to establish and automate best practices.
- Mandate Log Retention Policies: Use AWS Config rules or custom scripts to detect and automatically apply a default retention period (e.g., 30 days) to any new log group created without one.
- Control Log Verbosity: Enforce policies that restrict
DEBUGandINFOlogs in production environments. This can be done through code reviews, pre-deployment checks, or by using log processing agents to filter logs before they are ingested. - Review New Metrics: Implement a process for reviewing new custom metrics. Encourage teams to use existing metrics where possible and to be mindful of cardinality to avoid metric explosion.
Drive Accountability with KPIs
Provide engineering teams with dashboards that clearly show their attributed CloudWatch spend. Frame this data in the context of their KPIs. For example:
- Cost per Feature: Show how much it costs in monitoring to support a specific product feature.
- Cost per Transaction: For a transactional application, calculate the CloudWatch cost associated with each business transaction.
- Showback Reports: Regularly share reports that detail each team’s CloudWatch consumption. This visibility is often enough to encourage self-optimization.
Foster Collaboration
FinOps is a team sport. Create a feedback loop where engineers can see the cost impact of their changes and FinOps can understand the technical context behind the spend. Regular reviews and open communication channels are essential. When an engineer reduces log volume and sees their team’s showback costs decrease the next day, you reinforce the value of cost-conscious engineering.
By combining the right tools with a culture of accountability, you can transform CloudWatch from a source of budget anxiety into a well-managed and efficient component of your observability strategy.
Conclusion
Managing CloudWatch spend is a microcosm of the entire cloud financial management challenge. It’s a complex, usage-based service where default settings can lead to runaway expenses, and where technical decisions have direct financial consequences. Taming this spend requires moving beyond reactive bill analysis and toward a proactive, data-driven FinOps practice. Start with the foundational visibility provided by native AWS tools like Cost Explorer and a rigorous tagging strategy. Then, leverage the automation and business-centric context offered by third-party finops cloud cost tools to scale your efforts. Ultimately, the goal is not to eliminate monitoring costs but to ensure every dollar spent on observability delivers a clear return in operational stability and insight. After all, you can’t manage what you don’t measure, but you shouldn’t go broke measuring it, either.
If you’re ready to transform your CloudWatch spend from an opaque line item into a strategic asset, you can begin exploring Binadox’s dedicated FinOps capabilities by starting a free trial or by booking a demo to walk through its features.
 7-day free trial