



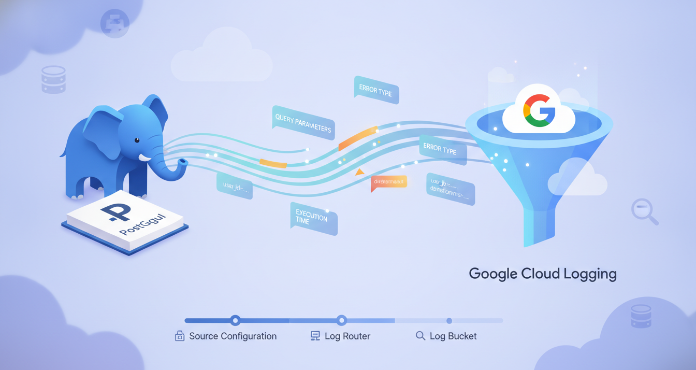
Configuring your PostgreSQL logs correctly is essential for maintaining a healthy, secure, and performant database in Google Cloud Platform (GCP). While default settings provide some information, they often leave significant gaps in operational visibility. Properly configured postgresql log flags give you the detailed diagnostic data needed to troubleshoot issues, optimize query performance, and meet compliance requirements. This article covers the best practices for setting these critical flags in a Cloud SQL environment.
Key takeaways
- Start with a Baseline: For most production systems, begin by setting
log_min_duration_statementto 1000ms to catch queries taking longer than one second. - Enhance Log Context: Use the
log_line_prefixflag to add valuable context like username, database, and application name to every log entry, making debugging significantly easier. - Enable pgAudit for Security: For any database containing sensitive data, enable the
cloudsql.enable_pgauditflag and configurepgaudit.logto create a detailed audit trail of database activity. - 4-Step Configuration: You can configure all flags in GCP by navigating to your Cloud SQL instance, clicking “Edit,” expanding the “Flags” section, and adding or modifying the required flags.
What Are PostgreSQL Log Flags and Why Do They Matter in GCP?
PostgreSQL log flags are special configuration parameters that control what the database server writes to its logs. In a managed environment like Google Cloud SQL, you can’t directly edit the postgresql.conf file; instead, you use the console, gcloud CLI, or Terraform to set these flags. These settings are your primary tool for adjusting the server’s logging behavior.
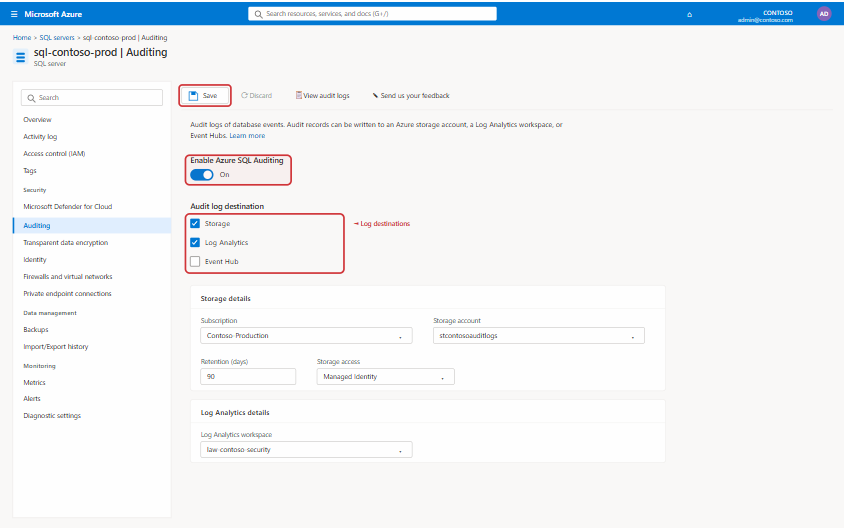
Properly configured logs are indispensable for several reasons. First, they provide the raw data needed for performance tuning. Without detailed logs, identifying slow or resource-intensive queries becomes a matter of guesswork. Second, for any application subject to compliance standards like PCI DSS or HIPAA, detailed audit logs are not optional—they are a requirement. Finally, when errors occur, well-structured logs are often the fastest path to a root cause analysis, reducing downtime and operational friction.
The GCP Context
Within GCP, Cloud SQL automatically integrates with Google Cloud Logging (formerly Stackdriver). This means that once you enable specific PostgreSQL log flags, the generated logs are sent directly to a centralized, searchable logging interface. This integration simplifies log management, allowing your team to query, analyze, and set up alerts on database events using a powerful, unified platform.
Getting Started: How to View and Set PostgreSQL Log Flags in Cloud SQL
Before changing anything, it’s important to know how to view and modify your instance’s current flag settings. GCP provides a straightforward interface for this.
You can manage these settings through the Google Cloud Console, the gcloud command-line tool, or Infrastructure as Code tools like Terraform.
To set a flag using the Google Cloud Console:
- Navigate to the Cloud SQL Instances page in the Google Cloud Console.
- Select the PostgreSQL instance you wish to configure.
- Click the Edit button at the top of the page.
- Scroll down and expand the Flags section.
- Click Add a database flag to set a new flag or modify an existing one from the list.
- Click Save to apply the changes. Note that changing some flags will require the instance to restart.
This simple process gives you granular control over your database’s logging behavior without needing to manage the underlying configuration files directly.
Core Logging Flags for Everyday Operations
For general-purpose database monitoring and troubleshooting, a few core flags are essential. These settings provide a balanced level of detail without generating excessive noise.
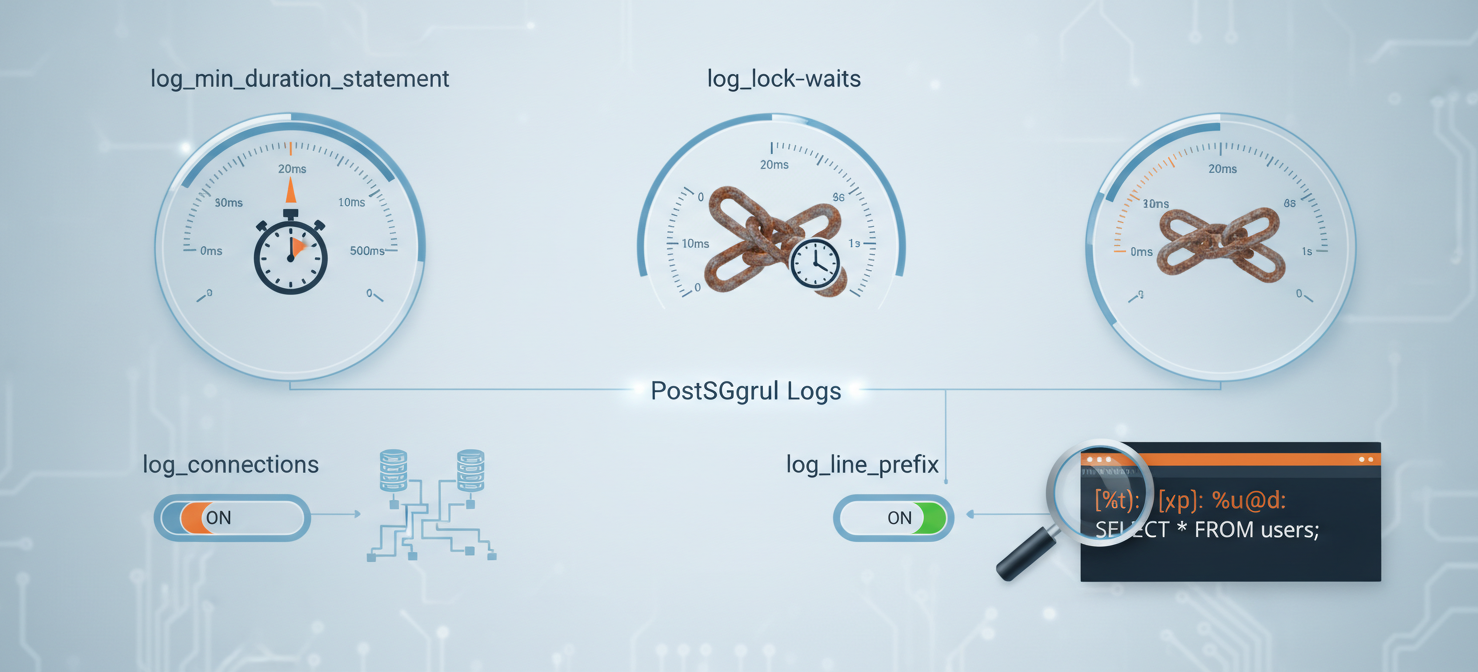
log_min_duration_statement: This is one of the most critical flags for performance monitoring. It logs any SQL statement that takes longer than the specified amount of time to execute. A good starting point for many applications is1000(in milliseconds), which logs all queries running for more than one second.log_connectionsandlog_disconnections: Setting these flags toonwill record every successful connection and session termination. This is useful for diagnosing connection-related issues, such as connection pool exhaustion.log_lock_waits: When a transaction has to wait for a lock for longer than thedeadlock_timeoutperiod, this flag ensures the wait is logged. This is invaluable for identifying and resolving contention issues in your database.log_checkpoints: This flag records the resource usage of checkpoints, which are I/O-intensive operations. Enabling this provides visibility into potential I/O bottlenecks.log_line_prefix: To make logs readable, this flag adds context to each log line. A helpful setting is%m [%p]: [%l-1] user=%u,db=%d,app=%a,client=%h, which includes the timestamp, process ID, log line number, user, database, application name, and client host.
Auditing and Security: PostgreSQL Log Flags for Compliance
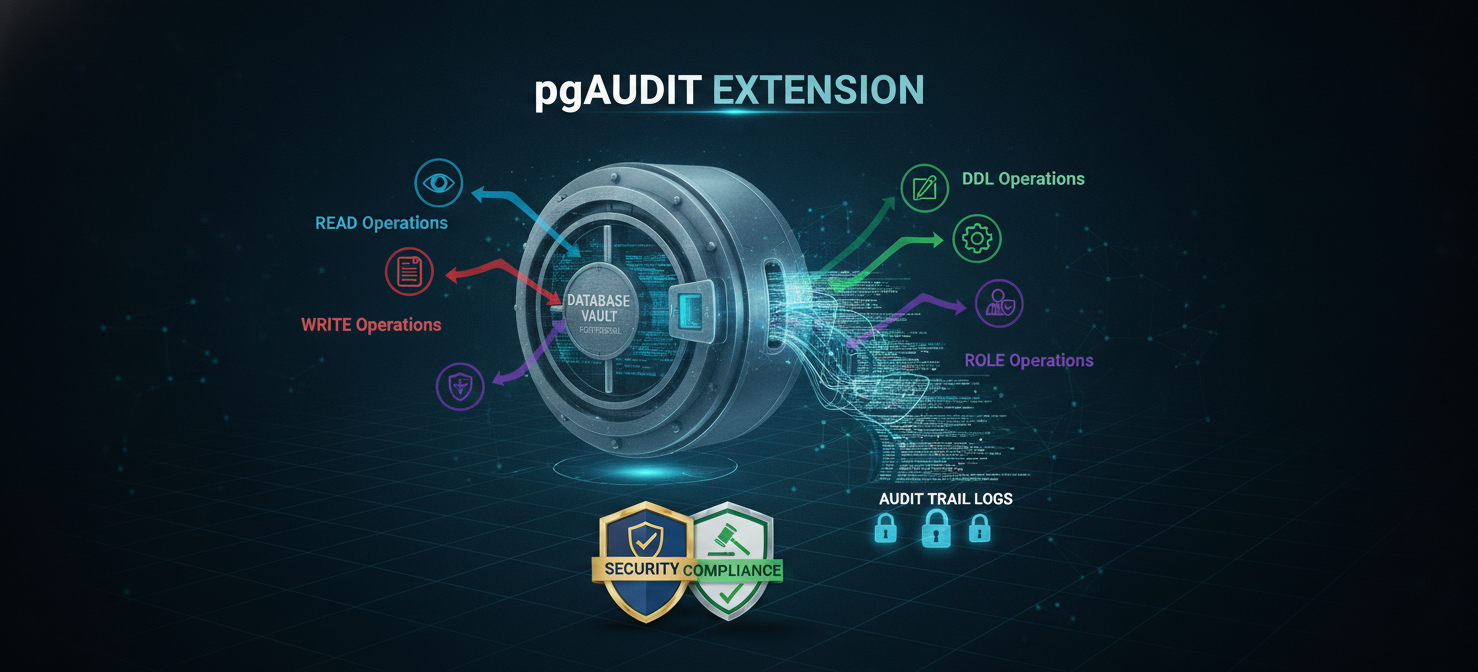
When your database handles sensitive information or must comply with regulatory standards, you need a robust audit trail. The pgAudit extension is the standard for providing detailed audit logging in PostgreSQL.
Enabling and Configuring pgAudit
To use pgAudit in Cloud SQL, you first need to enable the extension itself.
- Set the
cloudsql.enable_pgauditflag toon. This requires an instance restart. - After the instance restarts, connect to your database with a user that has the
cloudsqlsuperuserrole and run the command:CREATE EXTENSION pgaudit;.
Once enabled, you can configure what pgAudit logs using the pgaudit.log flag. This flag can be set to capture different classes of statements:
READ: LogsSELECTandCOPYstatements when the source is a relation or query.WRITE: LogsINSERT,UPDATE,DELETE,TRUNCATE, andCOPYwhen the destination is a relation.FUNCTION: Logs function calls andDOblocks.ROLE: Logs statements related to roles and privileges, likeGRANT,REVOKE, andCREATE/ALTER/DROP ROLE.DDL: Logs all Data Definition Language (CREATE,ALTER,DROP) that is not covered by theROLEclass.MISC: Logs other miscellaneous commands, likeDISCARD,FETCH,LISTEN, andSET.
For comprehensive auditing, a common setting is pgaudit.log = 'all'. However, be mindful that this can generate a high volume of logs. For a more targeted approach, you can specify a comma-separated list, such as pgaudit.log = 'READ,WRITE,DDL'.
Performance Tuning: Flags for Identifying Slow Queries and Bottlenecks
Beyond basic logging, certain flags are specifically designed to help you diagnose performance issues. These flags provide deeper insights into query execution and resource consumption.
Finding Slow Queries
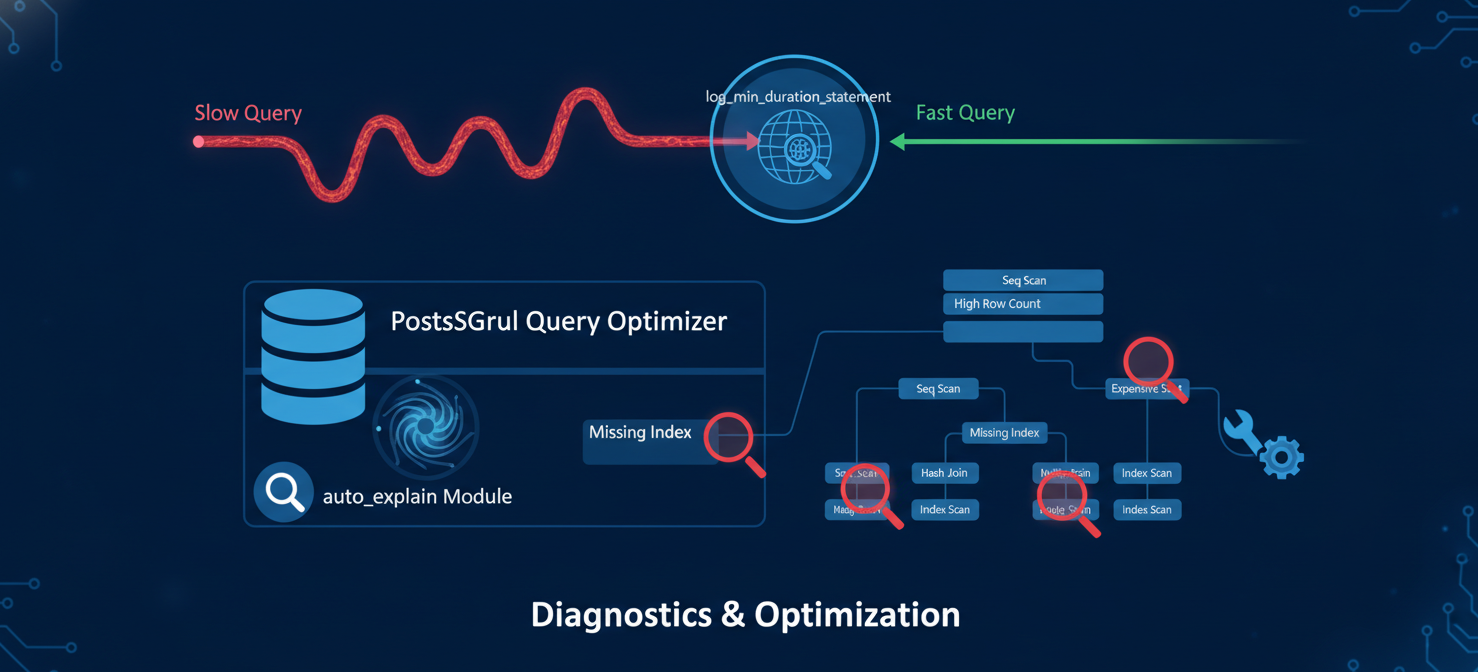
The log_min_duration_statement flag is the primary tool for identifying slow queries. By default, it is disabled (-1). Setting it to a value like 500 (milliseconds) will capture any query that takes half a second or longer to complete. It’s crucial to set this threshold to a level that is meaningful for your application’s performance targets. A setting of 0 will log every single statement, which is useful for short debugging sessions but should not be left on in production due to the high overhead.
Analyzing Query Plans
For truly problematic queries, you may need to see the execution plan that PostgreSQL is using. The auto_explain module can be a powerful ally here. To use it, you must first add auto_explain to the shared_preload_libraries flag. Then, you can configure its behavior with flags like:
auto_explain.log_min_duration: This tellsauto_explainto log the execution plan of any query that exceeds a certain duration. For example, setting it to2000will capture plans for queries running longer than two seconds. This is extremely useful because it shows you the plan for the actual slow execution, not just a theoretical plan from a manualEXPLAIN.auto_explain.log_analyze: Set this toonto get the equivalent ofEXPLAIN (ANALYZE, BUFFERS)output, providing richer detail on actual execution times and buffer usage.
Putting It All Together: A Recommended Baseline Configuration
Configuring postgresql log flags involves balancing the need for detailed information against the performance overhead and storage costs of logging. For a typical production environment in GCP, the following configuration provides a strong starting point.
Baseline Configuration:
log_min_duration_statement:1000(ms)log_connections:onlog_disconnections:onlog_lock_waits:onlog_checkpoints:onlog_line_prefix:%m [%p]: user=%u,db=%d,app=%a,client=%h
For Enhanced Security and Auditing:
cloudsql.enable_pgaudit:on(requires instance restart and runningCREATE EXTENSION)pgaudit.log:DDL,ROLE,WRITE
For Deep Performance Analysis (Enable Temporarily):
auto_explain.log_min_duration:1000(ms)auto_explain.log_analyze:onlog_min_duration_statement:0(for capturing all queries during a specific debugging window)
Remember to apply these settings methodically and monitor their impact. Start with the baseline, and only enable more verbose logging, like for auto_explain or pgaudit.log = 'all', when actively investigating a specific issue.
Conclusion
Mastering PostgreSQL log flags in GCP is not about enabling every option available. It’s about making deliberate choices to gain the visibility you need to ensure your database is performant, secure, and reliable. By moving away from the default settings and implementing a thoughtful logging strategy, you equip your team with the data required to solve problems before they escalate. The right set of postgresql log flags transforms your logs from a passive record into an active diagnostic tool. Neglecting them is like flying without a flight recorder; things might be fine for a while, but when trouble hits, you’ll wish you had the data.
To move beyond basic logging and unlock the full diagnostic potential of your PostgreSQL instances in GCP, our platform offers advanced management capabilities. You can experience these benefits directly by starting a free trial, or for a deeper dive into tailored solutions, we invite you to book a personalized demo with our experts.
 7-day free trial