



As a FinOps lead or cost analyst, your team is likely trapped in a cycle of manual data wrangling. You spend countless hours pulling CSVs from Azure Cost Management, wrestling with spreadsheets, and struggling to provide timely, actionable cost insights to engineering and leadership. This manual effort is not just a drain on resources; it’s a significant bottleneck that prevents proactive cost optimization. The core challenge is turning a flood of granular billing data into clear, attributable reports that drive accountability. Effective Azure FinOps reporting automation is the key to breaking this cycle, transforming cost management from a reactive, month-end scramble into a continuous, data-driven practice. By automating the flow of cost data, you can shift your focus from tedious data preparation to high-value analysis, enabling your organization to make smarter decisions about its cloud spend.
Key takeaways
- Slash Reporting Time: Automating the data pipeline from Azure Cost Management to your BI tool can reduce the time spent on manual report generation by over 75%, freeing up analysts for higher-value activities.
- Foundation First: A successful automation strategy is built on a robust cost allocation model; without a comprehensive tagging and resource hierarchy strategy, your automated reports will lack the necessary context for chargeback and showback.
- Five-Step Implementation: You can achieve end-to-end reporting automation in five key steps: establish a cost allocation strategy, automate data exports, ingest and model the data, build dashboards, and implement anomaly detection.
- From Visibility to Accountability: The ultimate goal of automation is to evolve from simple cost visibility (showback) to full financial accountability (chargeback), driving a culture of cost ownership among engineering teams.
The Manual Reporting Trap: Why Your Team is Overwhelmed
The daily reality for many cost analysts involves a significant amount of repetitive, low-value work. The process often starts with navigating the Azure portal to manually download usage and cost details. These files, often massive CSVs, must then be cleaned, merged with other data sources—like a CMDB or application owner manifests—and painstakingly modeled in Excel or a BI tool before any meaningful analysis can begin. This cycle repeats daily, weekly, and monthly, consuming a substantial portion of your team’s capacity.
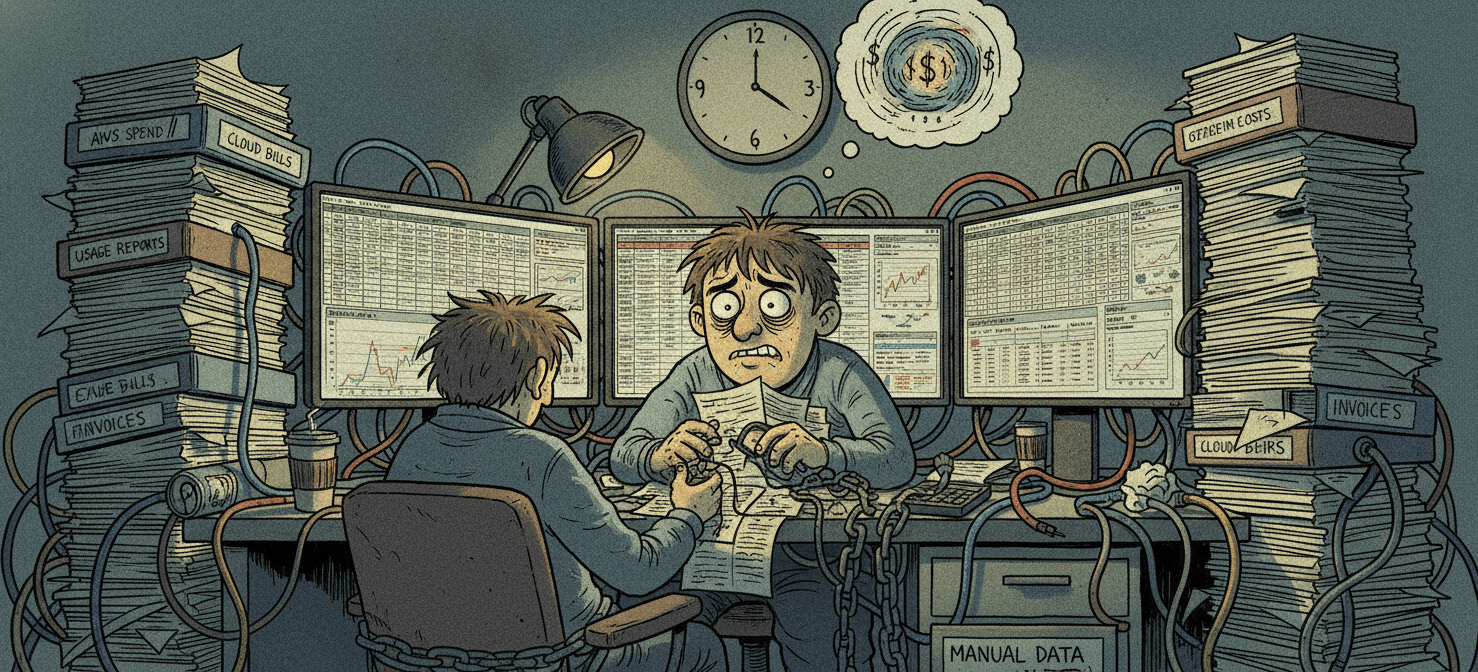
This manual approach creates several critical problems. First, it introduces a significant time lag. By the time reports are ready, the data is already stale, making it difficult to catch cost spikes in near real-time. Second, it’s highly error-prone. Manual data manipulation inevitably leads to inconsistencies, which erode trust in the reports you provide. When engineering teams question the accuracy of your numbers, it undermines the entire FinOps practice. Finally, and most importantly, it keeps your team stuck in a reactive posture, focused on explaining past spending rather than proactively guiding future optimization.
Step 1: Establishing a Rock-Solid Cost Allocation Strategy
Before you can automate reporting, you must first ensure the underlying data is structured in a way that makes sense for your business. Without a clear cost allocation strategy, even the most sophisticated automation will produce reports that are unactionable. The foundation of this strategy is a comprehensive and consistently enforced tagging policy.
Designing Your Tagging Taxonomy
Your tagging strategy is the metadata layer that connects cloud resources to business context. For effective FinOps, your taxonomy must include tags that identify ownership and financial responsibility. At a minimum, every resource should be tagged with:
- CostCenter: The financial entity responsible for the cost, aligning directly with your organization’s accounting structure.
- Owner/Team: The engineering team or individual responsible for managing the resource.
- Application/Service: The business application or service the resource supports.
- Environment: The deployment stage (e.g.,
prod,staging,dev) to differentiate costs and apply different governance rules.
Enforcing Tagging with Azure Policy
A tagging policy is only effective if it’s enforced. Manually auditing for compliance is not scalable. Instead, you should leverage Azure Policy to automate governance. You can create policies that:
- Require specific tags to be present before a resource can be deployed.
- Append tags automatically based on the resource group or subscription.
- Audit for non-compliant resources and flag them for remediation.
Step 2: Automating Data Exports from Azure Cost Management
Once your data is well-structured, the next step is to get it out of Azure Cost Management and into a centralized location automatically. The native Exports feature in Azure Cost Management is the primary tool for this. It allows you to schedule recurring exports of your cost and usage data to an Azure Storage account.
Configuring Scheduled Exports
You can configure exports to run on a daily, weekly, or monthly basis. For most FinOps teams, a daily export of amortized costs is the recommended approach. This provides a consistent view of spending and smooths out the cost of one-time purchases like reservations.
When setting up an export, you will need to specify:
- Export Name: A descriptive name for the export job.
- Metric: Choose between “Actual Cost” or “Amortized Cost.”
- Scope: Define the scope of the export, such as a management group, subscription, or resource group.
- Storage Account: The destination Azure Storage account and container for the exported files.
- File Format: You can choose between CSV and Parquet. While CSV is universally compatible, Parquet is often more efficient for large datasets and analytics platforms.
Automating this export process ensures that a fresh, comprehensive dataset is always available for your reporting tools without any manual intervention.
Step 3: Ingesting and Modeling Data for Analysis
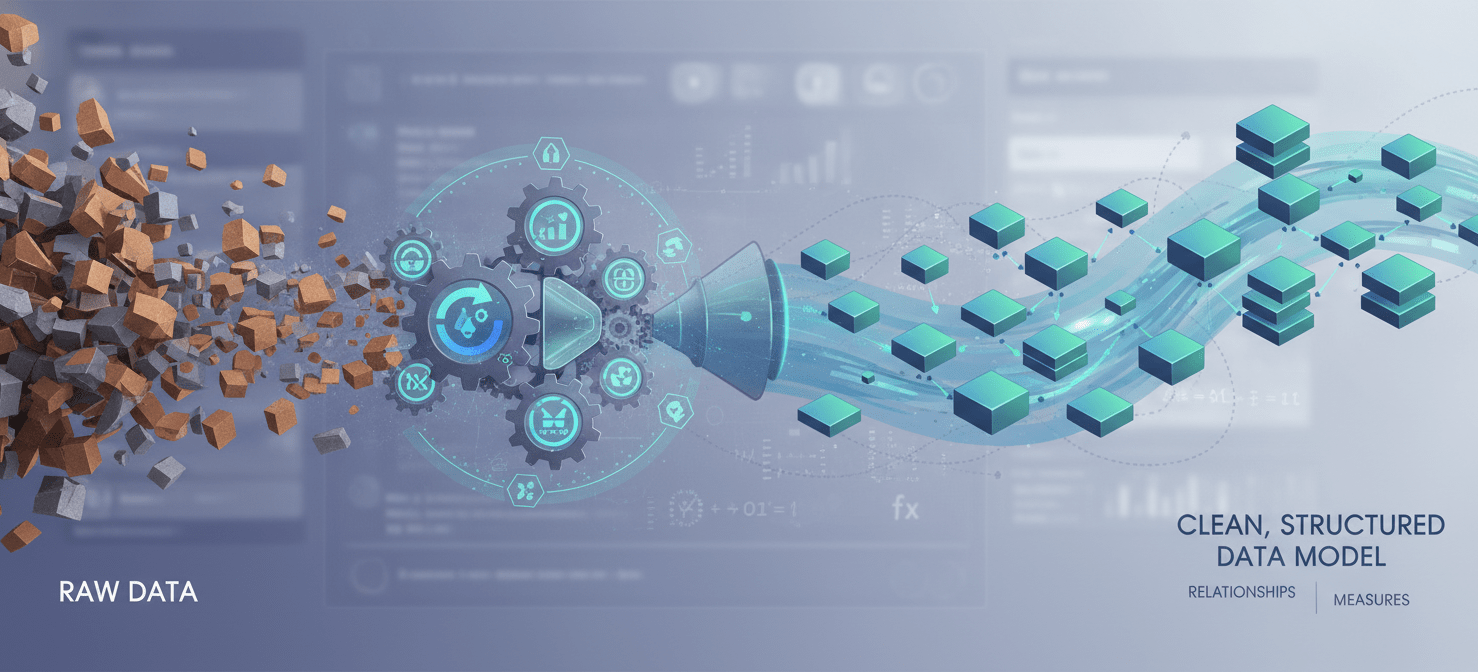
With your cost data automatically landing in Azure Storage, the next step is to ingest it into a BI platform like Power BI for analysis and visualization. This is where you transform raw, tabular data into a structured model that can be easily queried to build your reports and dashboards.
Connecting Power BI to Azure Storage
Power BI provides a native connector for Azure Blob Storage, making it straightforward to connect to the container where your cost exports are being delivered. You can configure Power BI to automatically detect new files in the container and append them to your dataset.
Data Modeling in Power BI
Once the data is ingested, the real work of a cost analyst begins. In the Power Query Editor within Power BI, you will perform several key transformations to create a usable data model:
- Data Cleansing: Handle any inconsistencies in your data, such as standardizing tag values (e.g., ensuring “prod” and “Production” are treated as the same environment).
- Creating Relationships: If you are bringing in other data sources, such as a CMDB or an application inventory, you will need to establish relationships between your cost data and these supplementary datasets.
- Building a Date Table: A dedicated date table is essential for performing time-based analysis, such as month-over-month or year-over-year cost comparisons.
- Creating Calculated Columns and Measures: This is where you define your key business metrics. Using Data Analysis Expressions (DAX), you can create measures for things like “Cost per CPU Hour,” “Storage Cost per GB,” or “Cost per Transaction.”
This data model becomes the single source of truth for all your FinOps reporting, ensuring consistency and accuracy across all dashboards.
Step 4: Building Your FinOps Dashboards and KPIs
With a robust and automated data model in place, you can now build the dashboards that will provide actionable insights to your stakeholders. The key is to tailor the information to the audience. A dashboard for an engineering lead should look very different from one for a VP of Finance.
Key Performance Indicators (KPIs) for FinOps
Your dashboards should be built around a set of core KPIs that measure the efficiency and effectiveness of your cloud spend. Some of the most critical FinOps KPIs include:
- Cost Allocation Accuracy: The percentage of your total cloud spend that can be attributed to a specific owner, team, or cost center. Your goal should be to get this number as close to 100% as possible.
- Resource Utilization: Metrics that track how effectively your provisioned resources are being used, such as CPU utilization for VMs or the percentage of idle resources.
- Spend Variance: The difference between your budgeted or forecasted spend and your actual spend.
- Unit Cost: A measure of the cost to produce a single unit of business value, such as the cost per customer or cost per transaction.
Tailored Dashboards for Different Audiences
- For Engineering Leads: Dashboards should focus on resource-level detail, highlighting underutilized or oversized resources within their specific applications. They need to see the direct cost impact of their architectural decisions.
- For Product Owners: Reports should frame cloud costs in the context of business value. The focus should be on unit economics, showing the cost to run a specific feature or support a certain number of users.
- For Finance and Leadership: These stakeholders need high-level views of spending trends, budget adherence, and overall cloud ROI. Their dashboards should summarize costs by business unit, product line, and strategic initiative.
By automating the data pipeline, you can ensure these dashboards are always up-to-date, providing a near real-time view of your organization’s cloud financial health.
Azure FinOps Reporting Automation: From Showback to Chargeback
The ultimate goal of FinOps is to instill a culture of cost accountability. Reporting automation is the mechanism that enables this cultural shift by providing the data needed to implement showback and, eventually, chargeback models.
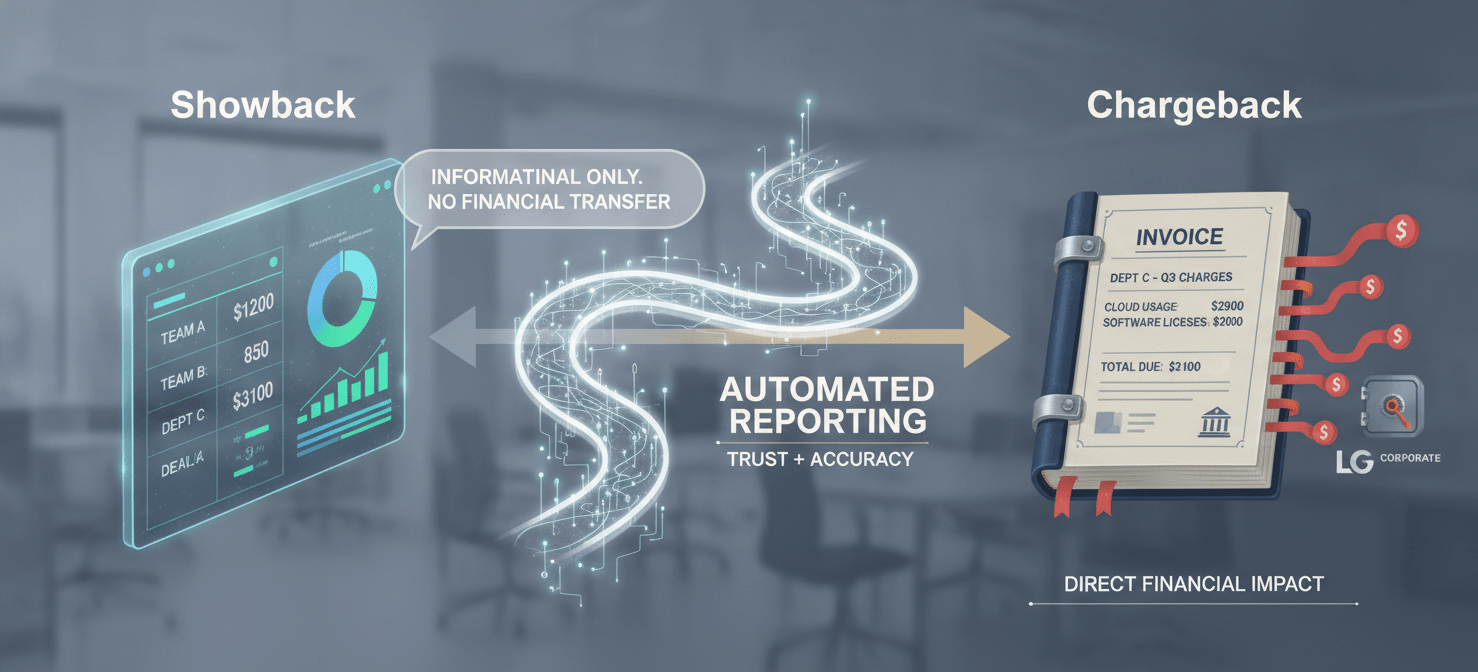
- Showback: In a showback model, you report cloud costs back to the teams that incurred them, but you don’t actually transfer the funds. The goal is to create visibility and encourage cost-conscious behavior. Automated dashboards are the primary tool for implementing showback. They provide teams with a clear, self-service view of their consumption.
- Chargeback: Chargeback takes this a step further by formally allocating cloud costs to the budgets of the respective business units or departments. This creates direct financial accountability. A fully automated and trusted reporting system is a prerequisite for chargeback. Without it, you will face constant disputes over the accuracy of the allocated costs.
By starting with showback and using your automated reports to build trust in the data, you can gradually mature your FinOps practice toward a full chargeback model, making every team a true owner of their cloud spend.
Step 5: Closing the Loop with Anomaly Detection and Alerts
The final piece of the automation puzzle is moving from passive reporting to proactive alerting. Even with the best dashboards, manually checking for cost spikes every day is inefficient. Azure Cost Management includes a built-in anomaly detection feature that can automatically identify unusual spending patterns.
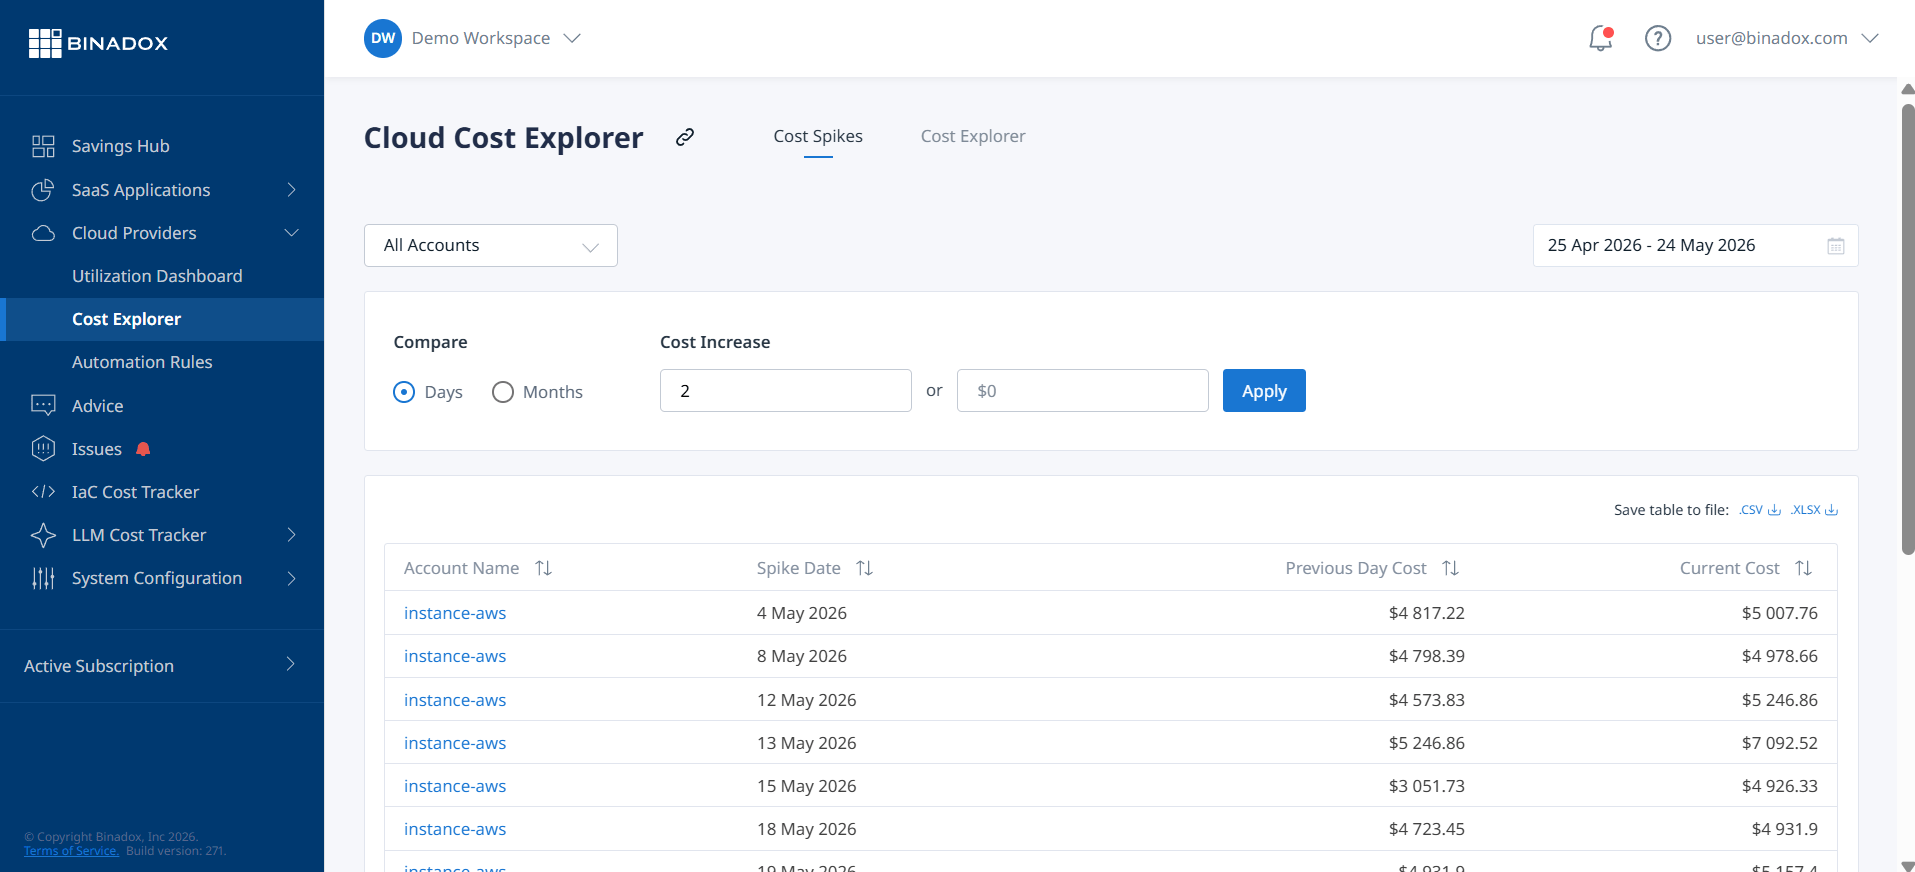
You can configure anomaly alerts to send email notifications to specific stakeholders when unexpected cost increases are detected. This allows you to catch runaway costs early, before they have a significant impact on your monthly bill. For more advanced scenarios, you can use Azure Logic Apps or Azure Automation to trigger automated responses to these alerts, such as shutting down non-essential resources or notifying a team via Slack or Microsoft Teams. This closes the loop on your automation strategy, creating a system that not only reports on costs but actively helps to control them.
Conclusion
The days of spending weeks buried in spreadsheets to answer basic questions about cloud spend are over. By implementing a systematic approach to Azure FinOps reporting automation, you can transform your team’s role from that of a reactive scorekeeper to a strategic financial advisor to the business. The process begins with a disciplined approach to cost allocation through tagging and governance. From there, you can automate the entire data pipeline, from export and ingestion to modeling and visualization. This frees your team to focus on what truly matters: analyzing data, identifying optimization opportunities, and fostering a culture of cost accountability. Ultimately, a well-automated reporting system is not just about creating dashboards; it’s about providing the timely, trusted data needed to make intelligent, value-driven decisions about your cloud investment. The alternative is to remain stuck in the manual reporting trap, forever looking in the rearview mirror.
To truly unlock the strategic potential of your FinOps practice and move beyond manual reporting, consider exploring how Binadox can streamline your Azure cost management, or if you prefer a direct conversation, you can schedule a personalized discussion with our experts.
 7-day free trial