



As a DevOps engineer, you live by metrics, logs, and alerts. They are the lifeblood of a healthy system. AWS CloudWatch is the default, go-to service for this, but its convenience can come at a steep, and often surprising, cost. When that monthly AWS bill arrives, the CloudWatch line item can be a source of significant friction between engineering and finance. The key is to treat observability as a feature with its own budget. This guide provides a technical, practitioner-focused approach to help you reduce CloudWatch costs by making deliberate, informed trade-offs without sacrificing the visibility you need to do your job effectively.
Key takeaways
- Set Log Retention Policies: By default, logs are stored forever. Implementing a 7-30 day retention policy for non-essential logs is one of the fastest ways to stop compounding storage costs.
- Use the Right Log Class: For logs you only query during debugging, the Infrequent Access (IA) log class can cut ingestion costs by 50% compared to the Standard class.
- Audit Custom Metrics: High-cardinality dimensions in custom metrics are a primary driver of unexpected costs. A single misconfigured metric can create thousands of unique metrics, each billed separately.
- Downgrade Alarm Resolution: High-resolution alarms cost 3x more than standard-resolution alarms ($0.30 vs. $0.10 per month). Audit your alarms and reserve high-resolution for only the most critical, sub-minute response scenarios.
Understanding CloudWatch Pricing
Before you can cut costs, you need to understand the moving parts of the bill. CloudWatch isn’t a single product; it’s a suite of services, each with a distinct pricing model. You don’t pay for “CloudWatch” as a whole, but for the specific components you use.
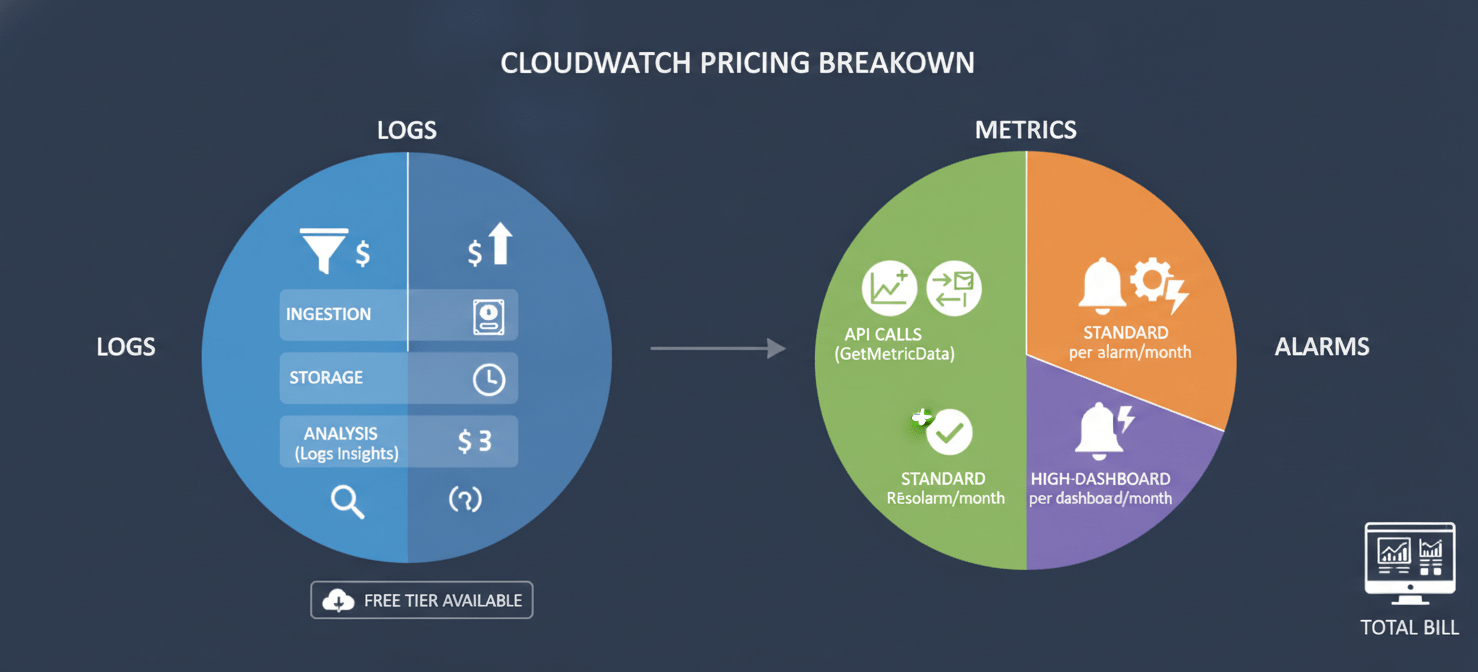
The main cost drivers are:
- Logs: You are charged for three separate actions: data ingestion (per GB), data storage (per GB-month), and data analysis via Logs Insights (per GB scanned). This “triple-charge” model is often the largest and most surprising part of the bill.
- Metrics: Costs are based on the number of custom metrics, with tiered pricing that decreases as your volume grows. The first 10,000 metrics are the most expensive tier. API calls to
PutMetricDataandGetMetricDataalso incur charges. - Alarms: You pay per alarm per month. High-resolution alarms (evaluating every 10 or 30 seconds) cost significantly more than standard-resolution alarms (evaluating every 60 seconds).
- Dashboards: After a small free tier of three dashboards, each additional custom dashboard has a monthly fee.
Other features like Contributor Insights, Synthetics Canaries, and RUM have their own pricing dimensions that add to the total. The key takeaway is that your bill is a direct result of the volume of data you send, how long you keep it, and how frequently you access it.
Analyze Your Current CloudWatch Spend
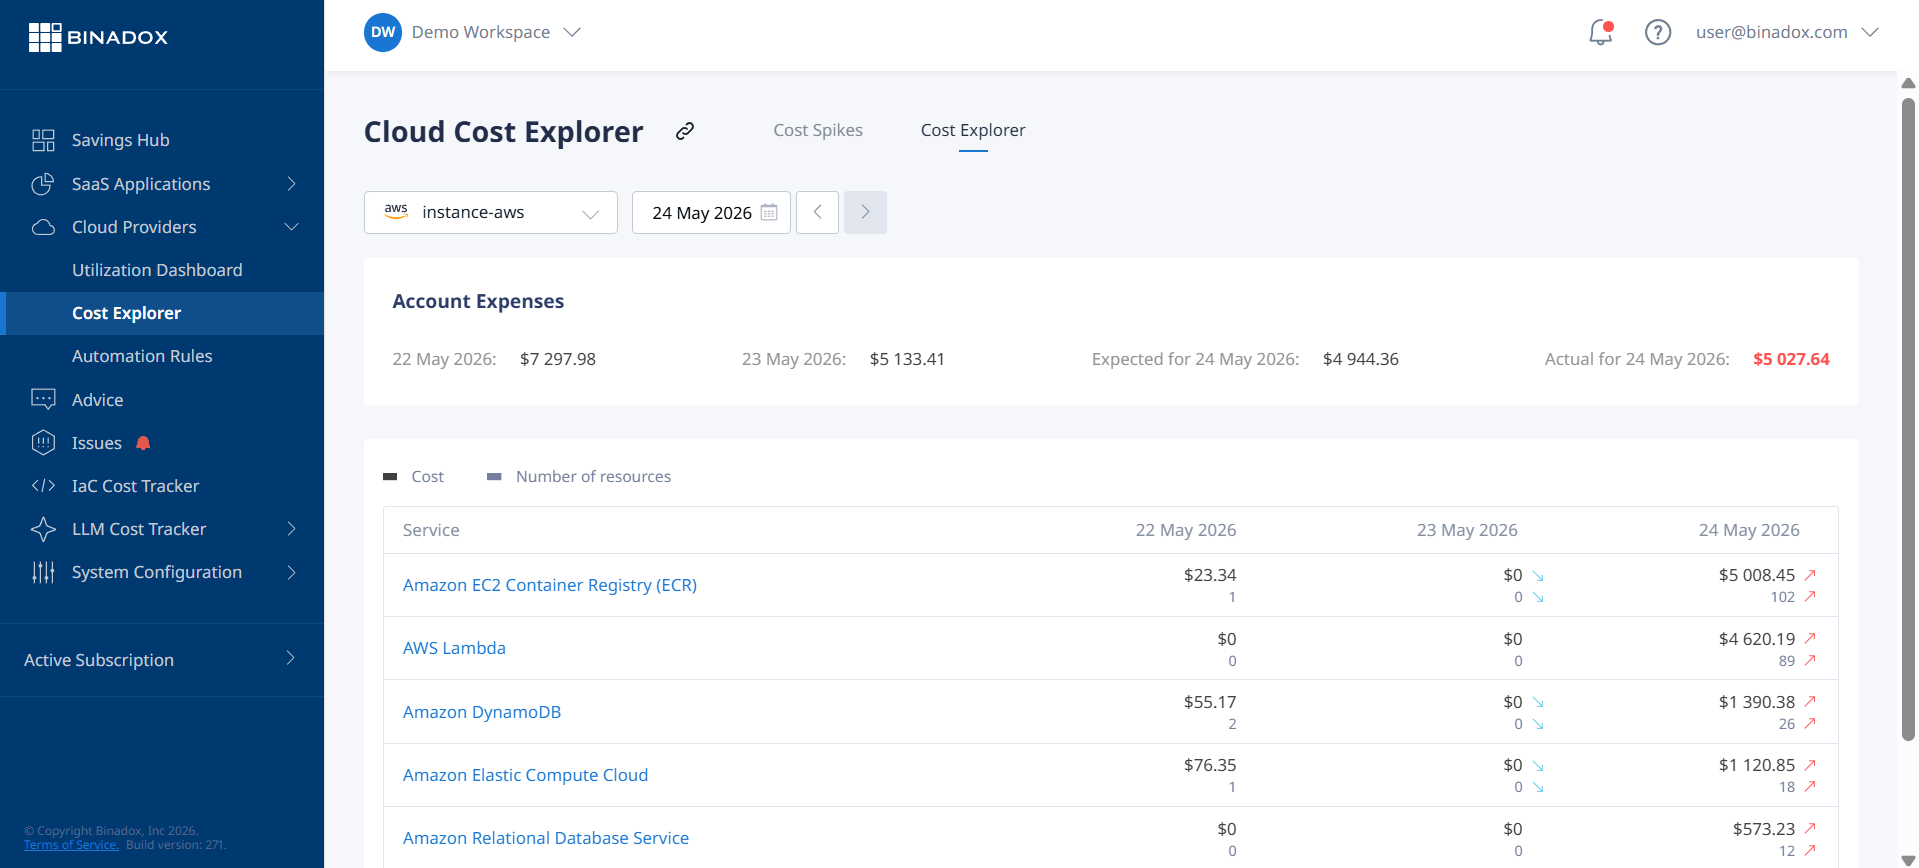
You can’t optimize what you can’t measure. The first step is to get a clear picture of where your money is going. Don’t fly blind; use AWS’s own tools to dissect your bill.
Using AWS Cost Explorer
AWS Cost Explorer is your primary tool for this task. It allows you to visualize and analyze your spending over time.
- Navigate to the AWS Cost Explorer service.
- In the right-hand filter panel, filter the Service to CloudWatch.
- Use the Group by dimension and select Usage Type. This will break down your spend into the specific components like
DataProcessing-Bytes(log ingestion),TimedStorage-ByteHrs(log storage), andMetricMonitorUsage(custom metrics).
This view will immediately highlight your biggest cost drivers. For most teams, log ingestion and custom metrics will be at the top of the list. You can further group by Region or Linked Account to pinpoint specific environments or services that are generating the most cost.
Finding the Noisiest Log Groups
Once you’ve identified that logs are a major cost, the next step is to find out which log groups are the culprits. A few noisy applications can easily dominate your ingestion bill. You can use a simple AWS CLI command combined with jq to get a sorted list of your log groups by their stored size.
aws logs describe-log-groups --query 'logGroups[*].[logGroupName, storedBytes]' --output text | sort -k2 -nr | head -n 20
This command lists your top 20 largest log groups, giving you a clear hit list for your optimization efforts.
How to Reduce CloudWatch Costs for Logs
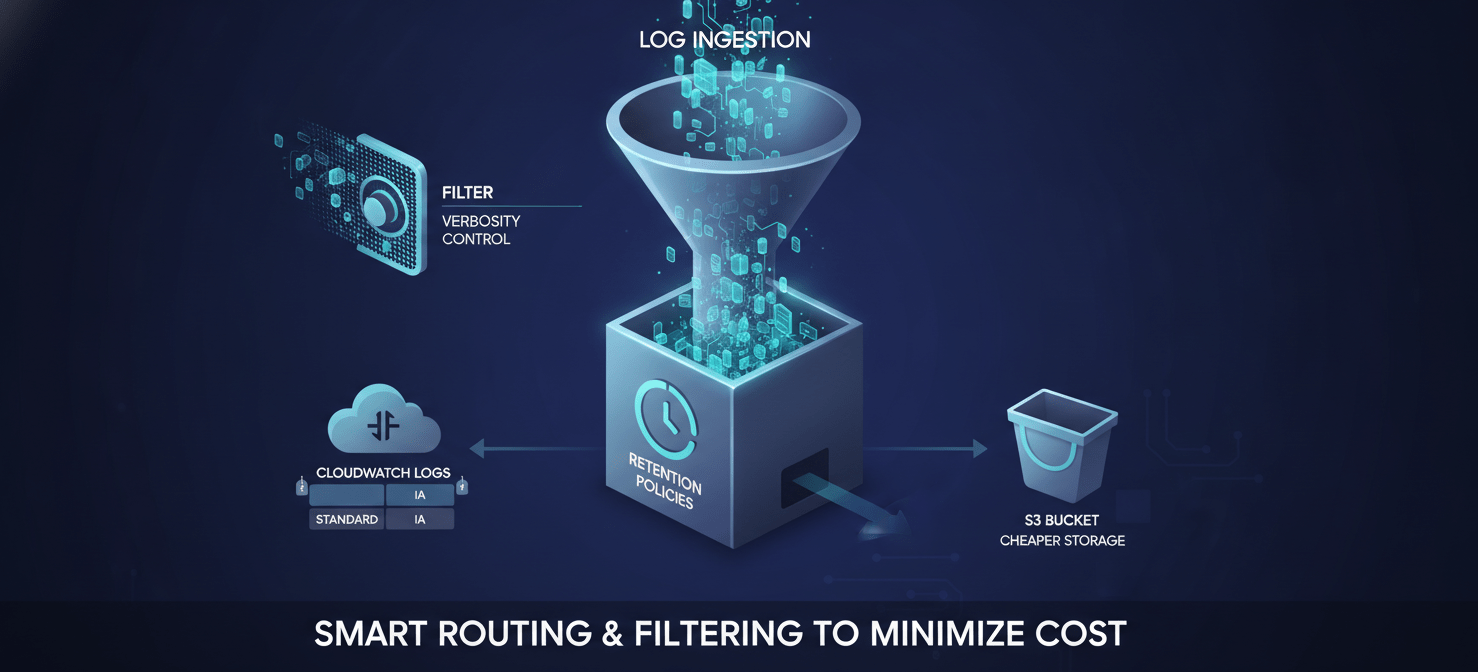
Since logs are often the biggest expense, they present the biggest opportunity for savings. Your strategy should focus on two main goals: ingesting less data and storing that data for a shorter period.
Set Aggressive Log Retention Policies
By default, CloudWatch log groups retain data forever. This is a silent but deadly cost driver, as storage charges compound month over month. For most development and staging environments, and even many production applications, you don’t need logs from six months ago.
Action:
- Audit every log group. Identify its purpose and the actual retention period required for compliance or debugging.
- Implement a default retention policy. For non-critical applications, a retention period of 7, 14, or 30 days is often sufficient.
- Automate enforcement. Use Infrastructure as Code (Terraform, CloudFormation) or custom scripts to ensure every new log group is created with an explicit, non-infinite retention period.
You can set the retention for a specific log group with a single CLI command:
aws logs put-retention-policy --log-group-name "/your/log/group" --retention-in-days 14
Control Log Verbosity at the Source
The most effective way to reduce ingestion costs is to simply send fewer logs. Many applications in production are configured to log at INFO or even DEBUG levels, generating a massive volume of low-value data.
Action:
- Review application logging levels. Ensure production services are logging at
WARNorERRORlevels by default. Only enable more verbose logging temporarily during incident response. - Filter logs before they leave the instance. You can configure the CloudWatch Agent, Fluent Bit, or FireLens to drop log entries that match certain patterns (e.g., health checks) or don’t meet a minimum severity level. This prevents noisy, low-value logs from ever hitting the ingestion endpoint and incurring charges.
Use the Right Log Class for the Job
CloudWatch offers two main log classes: Standard and Infrequent Access (IA). The IA log class offers a 50% discount on ingestion costs. The trade-off is that IA logs do not support metric filters or live tailing.
Action:
- Identify log groups that are used primarily for forensic analysis with Logs Insights (e.g., application debug logs, historical records).
- For these logs, choose the Infrequent Access log class upon creation. This is an ideal choice for logs you need to keep but don’t need to monitor in real-time.
- Note: The log class cannot be changed after a log group is created, so this decision must be made upfront.
Route High-Volume Logs to S3
For certain types of high-volume, compliance-oriented logs like VPC Flow Logs or CloudTrail events, CloudWatch may not be the most cost-effective destination. Routing them directly to Amazon S3 can be dramatically cheaper.
Cost Comparison (First Month):
- CloudWatch: $0.50/GB ingestion + $0.03/GB storage.
- S3: ~$0.023/GB storage + query costs with Athena.
You can still analyze these logs using Amazon Athena, which charges based on data scanned. For logs that are infrequently queried, this is a far more economical approach.
Optimize CloudWatch Metrics Usage
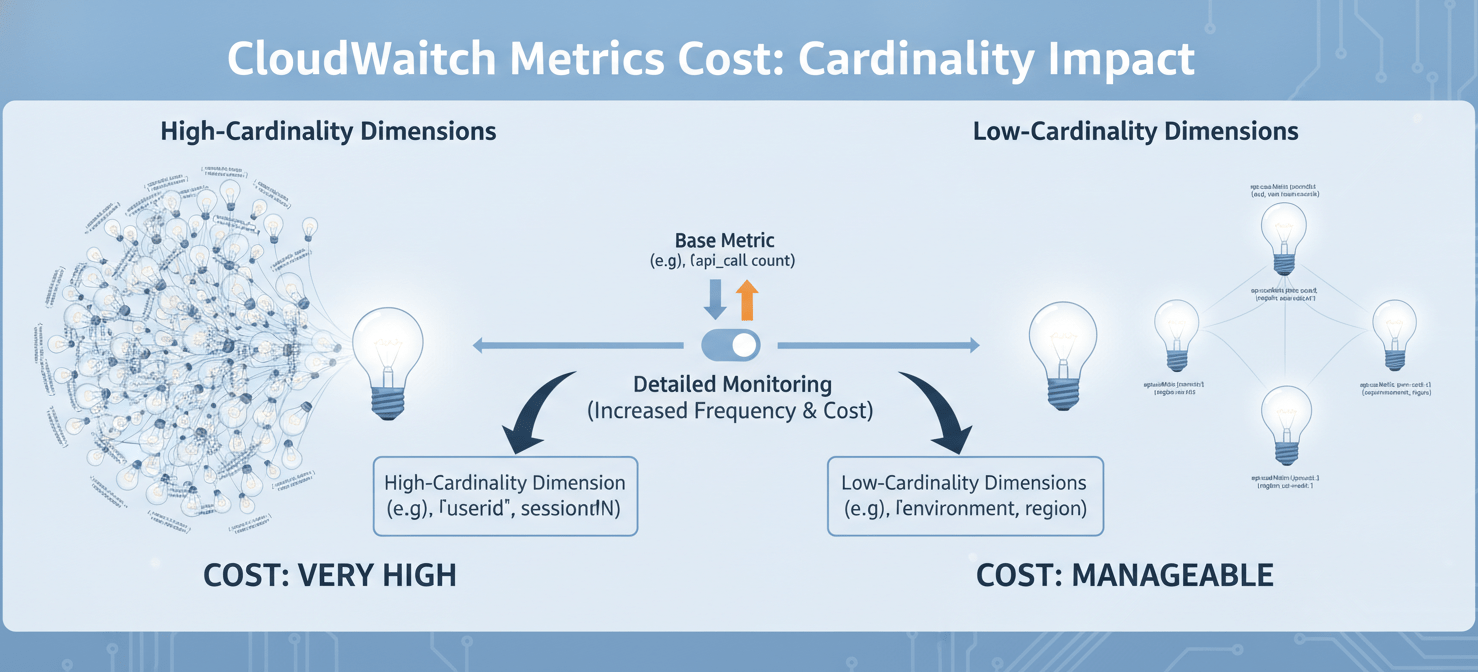
Custom metrics are the second major area where costs can spiral out of control, often due to a single, subtle mistake: high-cardinality dimensions.
Tame High-Cardinality Dimensions
A CloudWatch metric is defined by its name and a set of key-value pairs called dimensions. Each unique combination of dimensions creates a new metric that you are billed for.
For example, if you create a metric HttpRequestTime with dimensions for endpoint and http_method, that’s fine. But if you add a dimension for user_id or session_id, you will create a brand new metric for every single user. A system with 10,000 users would generate 10,000 metrics, leading to a bill of thousands of dollars.
Action:
- Audit all custom metrics. Look for dimensions that could have a large number of unique values.
- Never use unbounded identifiers (like user IDs, session IDs, request IDs) as metric dimensions.
- Aggregate data within your application before publishing the metric. For instance, instead of a metric per user, publish a single metric for the total number of active users.
Be Selective with Detailed Monitoring
By default, EC2 instances publish metrics every 5 minutes. Enabling “Detailed Monitoring” increases the frequency to 1 minute, but it comes at a cost. Each of these 1-minute metrics is charged as a custom metric. For a large fleet of instances, this can add up quickly.
Action:
- Evaluate which instances truly require 1-minute granularity for auto-scaling or critical alerting.
- For less critical workloads, development environments, or stable applications, stick with the default 5-minute interval. The cost savings can be substantial.
Fine-Tuning Alarms and Dashboards
While less expensive than logs and metrics, costs for alarms and dashboards can still become significant if left unmanaged.
Use Standard-Resolution Alarms by Default
High-resolution alarms, which evaluate every 10 or 30 seconds, cost three times as much as standard-resolution alarms. Most workloads do not require this level of responsiveness.
Action:
- Make standard-resolution ($0.10/alarm/month) your default for all new alarms.
- Only use high-resolution ($0.30/alarm/month) when you have a specific, documented need for sub-minute alerting, such as for a critical customer-facing API with a strict SLA.
- Regularly audit your existing alarms and downgrade any high-resolution alarms that are not absolutely necessary.
Clean Up Unused Dashboards
After the free tier of three dashboards, you pay a monthly fee (around $3.00) for each additional dashboard. Over time, it’s easy to accumulate dashboards for old projects, temporary incidents, or individual experiments.
Action:
- Periodically review all custom dashboards in your account.
- Delete any that are no longer actively used. This is a simple but effective bit of housekeeping that directly reduces your monthly bill.
Leveraging Other AWS Services for Cost Savings
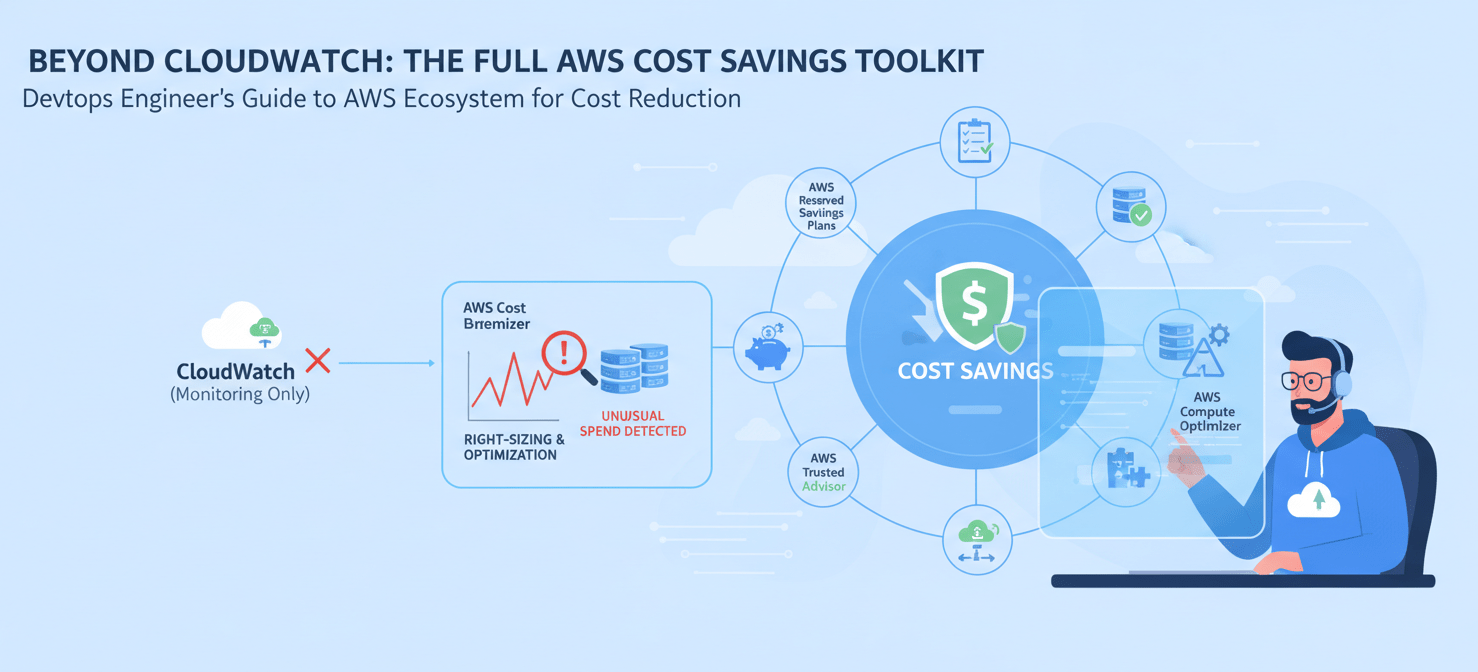
Sometimes, the best way to reduce CloudWatch costs is to use a different tool for the job.
AWS Cost Anomaly Detection
Instead of trying to build a complex set of billing alarms within CloudWatch, use the dedicated AWS Cost Anomaly Detection service. It’s part of the AWS Cost Management suite and uses machine learning to monitor your spending patterns and alert you to unusual increases, often with more context than a simple CloudWatch billing alarm.
AWS Compute Optimizer
For right-sizing your infrastructure, rely on AWS Compute Optimizer. It analyzes CloudWatch metrics for your EC2 instances, Auto Scaling groups, and Lambda functions to provide specific recommendations for downsizing overprovisioned resources. This is more effective than setting up dozens of individual CPU and memory alarms.
Implementing a Governance and Monitoring Strategy
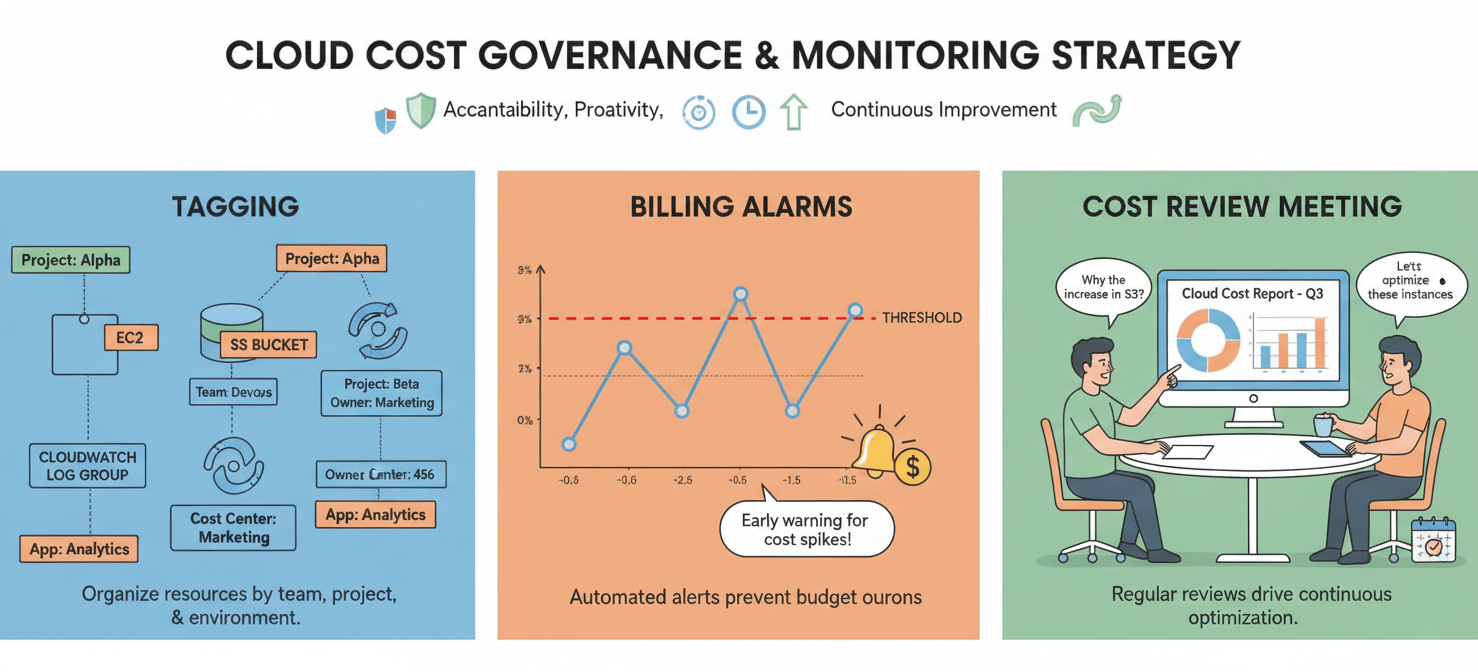
Technical fixes are only part of the solution. To achieve lasting savings, you need to implement a strategy for governance and ongoing monitoring.
Tag Everything
Tagging is critical for cost allocation. Enforce a tagging policy where all resources, including CloudWatch Log Groups, are tagged with an owner, team, or project. This allows you to use AWS Cost Explorer to attribute CloudWatch spend back to the teams responsible, creating accountability.
Set Up Billing Alarms
Create a high-level billing alarm in CloudWatch. This won’t tell you why your costs are high, but it will serve as an essential early warning system. Set an alarm to notify your team via SNS or Slack if your estimated monthly CloudWatch charges exceed a defined threshold. This prevents end-of-month surprises.
Make Cost Review a Habit
Finally, make cost optimization a regular part of your team’s operational rhythm. Review your CloudWatch spend in Cost Explorer on a monthly or bi-weekly basis. Discuss the top cost drivers in your team meetings. When cost becomes a shared KPI, engineers will naturally start to build more cost-aware systems.
Conclusion
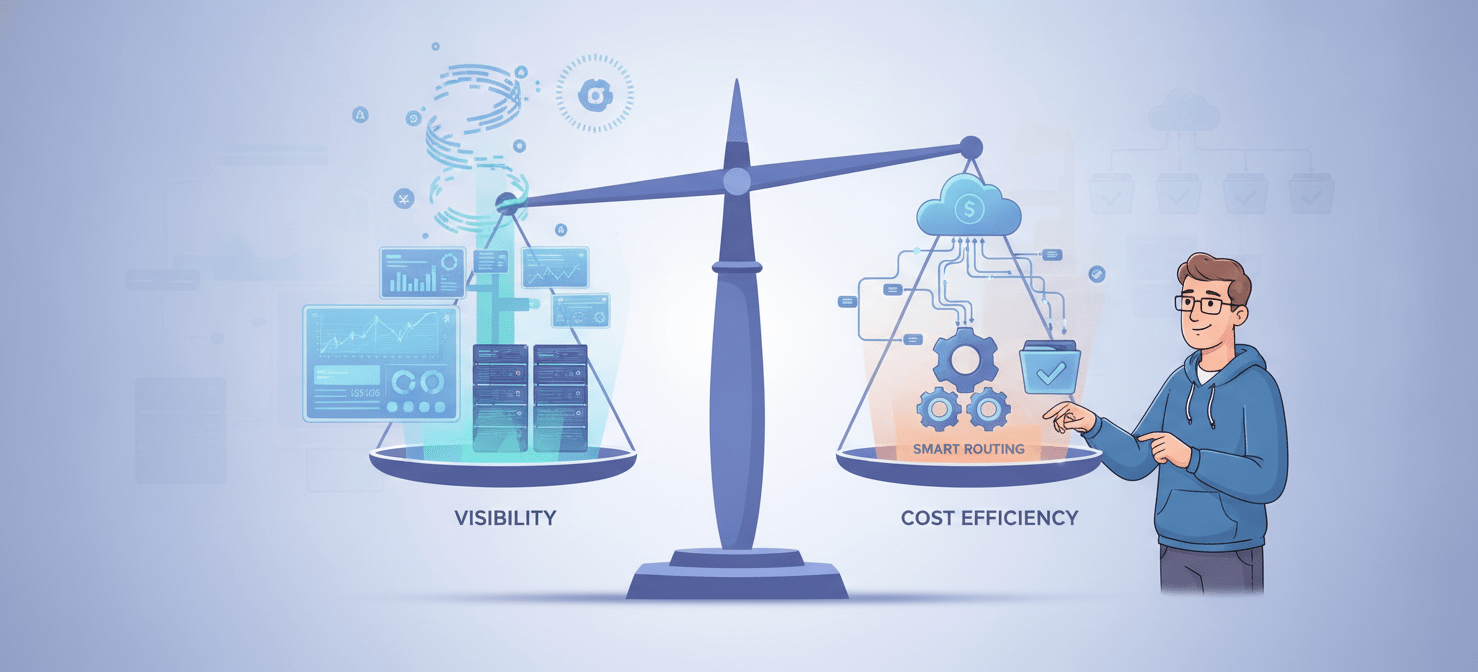
CloudWatch is an indispensable tool, but its pay-for-what-you-use model can easily lead to runaway spending if not managed with intention. The path to reduce CloudWatch costs isn’t about turning off monitoring; it’s about being deliberate. By analyzing your spend, aggressively managing log ingestion and retention, taming high-cardinality metrics, and choosing the right resolution for your alarms, you can significantly cut your bill without losing critical visibility. Ultimately, treating observability spend as a budgeted, engineered part of your system—rather than an accidental byproduct—is the key. Don’t let your monitoring bill be a source of fear; make it a reflection of efficient, intentional engineering.
To truly transform your monitoring bill into a reflection of efficient, intentional engineering, consider how a dedicated platform can streamline this process; you can easily explore Binadox’s capabilities with a free trial or schedule a personalized demonstration with our experts.
 7-day free trial