


Your cloud bill arrives like a cryptic message from a distant planet. It’s dense, filled with technical jargon, and seems to grow exponentially each month. You know you’re paying for innovation and scalability, but understanding the specific value of each line item feels impossible. This financial complexity is a direct side effect of the cloud’s greatest strength: its on-demand, pay-as-you-go nature. Without the right strategy and a proper cloud billing solution, this flexibility can lead to significant financial waste. This guide will help you decode your AWS, Azure, and GCP invoices, turning that confusing data into clear, actionable business insights.
Key takeaways:
- Enterprises waste up to 29% of their cloud expenditure due to a lack of visibility and control.
- Raw billing data from providers like AWS, Azure, and GCP lacks the business context needed for financial accountability, often leaving 30-50% of spend untagged.
- Implementing a FinOps framework built on tagging, cost allocation, and a centralized cloud billing platform is essential to connect technical spending to business value.
- Automated tools can reduce cloud and SaaS budgets by 30% to 40% by identifying waste, rightsizing resources, and providing proactive budget alerts.
Why Cloud Bills Are So Difficult to Understand
Cloud computing revolutionized IT by offering incredible flexibility, but it also created a new level of financial confusion for many organizations. The trouble with understanding cloud bills comes from a mix of complex pricing, huge amounts of data, and decentralized spending.
Unlike traditional IT with its fixed hardware costs, cloud resources are billed on a consumption model—per second, per gigabyte, or per API call. A single enterprise account on Amazon Web Services (AWS), Microsoft Azure, or Google Cloud Platform (GCP) can produce millions of distinct line items every month. Each line is filled with technical terms for components like Elastic Block Store (EBS) volumes, Relational Database Service (RDS) instances, or Kubernetes clusters, which can overwhelm finance teams.
This technical detail often paralyzes financial planning. Billing reports list raw service names that give no business context, making it nearly impossible for an analyst to know if a compute instance is for a critical application or a forgotten test environment. The technical nature of these records, along with constant price changes, makes managing expenses a difficult task.
Furthermore, the problem is made worse by the many and frequently changing pricing models from cloud providers. They offer various discount programs like Reserved Instances (RIs), Savings Plans, and Committed Use Discounts (CUDs), which require upfront commitments for lower rates. While these can save money, they create complex accounting challenges. Misunderstanding the balance between on-demand spending and commitment coverage can cause serious budget forecasting errors.
The results of this complexity are severe. Instead of reducing IT expenses, the lack of visibility often leads to “cloud sprawl” and major overspending. Research shows that a shocking 80% of enterprises find it hard to effectively optimize their cloud costs.
Recent data highlights this ongoing crisis. According to the Flexera 2026 State of the Cloud Report, estimated wasted cloud spend reached 29%, the first increase after five years of decline. This rise is largely due to the rapid adoption of Artificial Intelligence workloads, which use computing power in expensive, irregular bursts that old budgeting methods can’t handle. Beyond the financial cost, this inefficiency also has environmental consequences, as data centers consume massive amounts of electricity.
What AWS, Azure, and GCP Billing Data Actually Tells You
Billing data from major cloud providers like AWS, Azure, and GCP is essentially a detailed log of your infrastructure usage. However, what this data truly reveals depends heavily on how you extract, process, and normalize it.
Every major cloud provider tracks resource use at a microscopic level. When a virtual machine starts, a database is queried, or a file is stored, the provider logs it in units like compute hours or gigabytes. This raw data is then run through a complex billing engine that applies the correct price based on the resource type, region, and pricing model.
The output comes in provider-specific formats:
- AWS provides detailed records through its Cost and Usage Reports (CUR), which deliver hourly or daily line-item data to an Amazon S3 bucket.
- Azure offers data via Azure Cost Management and Billing exports, which can be accessed through APIs or sent to blob storage.
- GCP uses Cloud Billing to send detailed, continuous data exports directly into Google BigQuery for analysis.
While these native exports are thorough, they are also highly inconsistent. Each provider uses its own terminology, pricing structures, and data formats. This fragmentation makes multi-cloud cost management a significant engineering challenge, often leading to reporting errors and inefficiencies.
It’s also important to recognize the delay in the billing pipeline. Billing data is rarely available in real-time; it is typically delayed by 24 to 72 hours. This means native billing consoles show what you have already spent, making it nearly impossible to control costs proactively without a third-party tool.
To solve the variance among provider data, the FinOps Foundation created the FinOps Open Cost & Usage Specification (FOCUS). FOCUS is an open-source standard designed to normalize billing data across all major clouds. It allows organizations to run uniform queries across their entire multi-cloud environment without manually untangling provider-specific details.
Ultimately, the raw data from these providers tells a purely operational story. It lists what technical resources were used, for how long, and at what price. It does not, however, explain why a resource was launched, who approved it, or which business product it supports.
Decoding Cloud Billing: Usage, Rates, Resources, and Charges
To make sense of cloud invoices, your team must understand the relationship between usage, rates, resources, and the final charges. The cloud billing system is highly variable, where simply having a resource doesn’t mean a fixed monthly fee.
The Fundamentals of Cloud Metering
Cloud billing is based on a metered model, meaning you are charged for what you actually consume. A “resource” is any provisioned item, like an AWS EC2 instance or a GCP BigQuery dataset. “Usage” measures how that resource was used, and “Rates” are the cost applied to each unit of usage. Together, these factors determine the final “Charge.”
On-Demand vs. Commitment Pricing
The complexity grows when you move beyond on-demand pricing. On-demand pricing is the most flexible but also the most expensive way to use cloud services, as it charges the full rate with no long-term commitment. To lower costs, providers offer commitment-based discounts—like Reserved Instances in AWS, Reservations in Azure, and Committed Use Discounts (CUDs) in GCP. By committing to a certain usage level for a 1- or 3-year term, you receive significant rate reductions.
These discounts are applied at the billing layer and require no changes to your technical infrastructure. However, managing them can be tricky. A common reason for overspending is failing to model commitment coverage correctly, leaving companies to pay expensive on-demand rates for usage that should have been covered by a commitment.
Amortized vs. Non-Amortized Costs
One of the biggest sources of confusion is the difference between amortized and non-amortized costs. Misunderstanding these two views can lead to budget chaos and incorrect financial reporting.
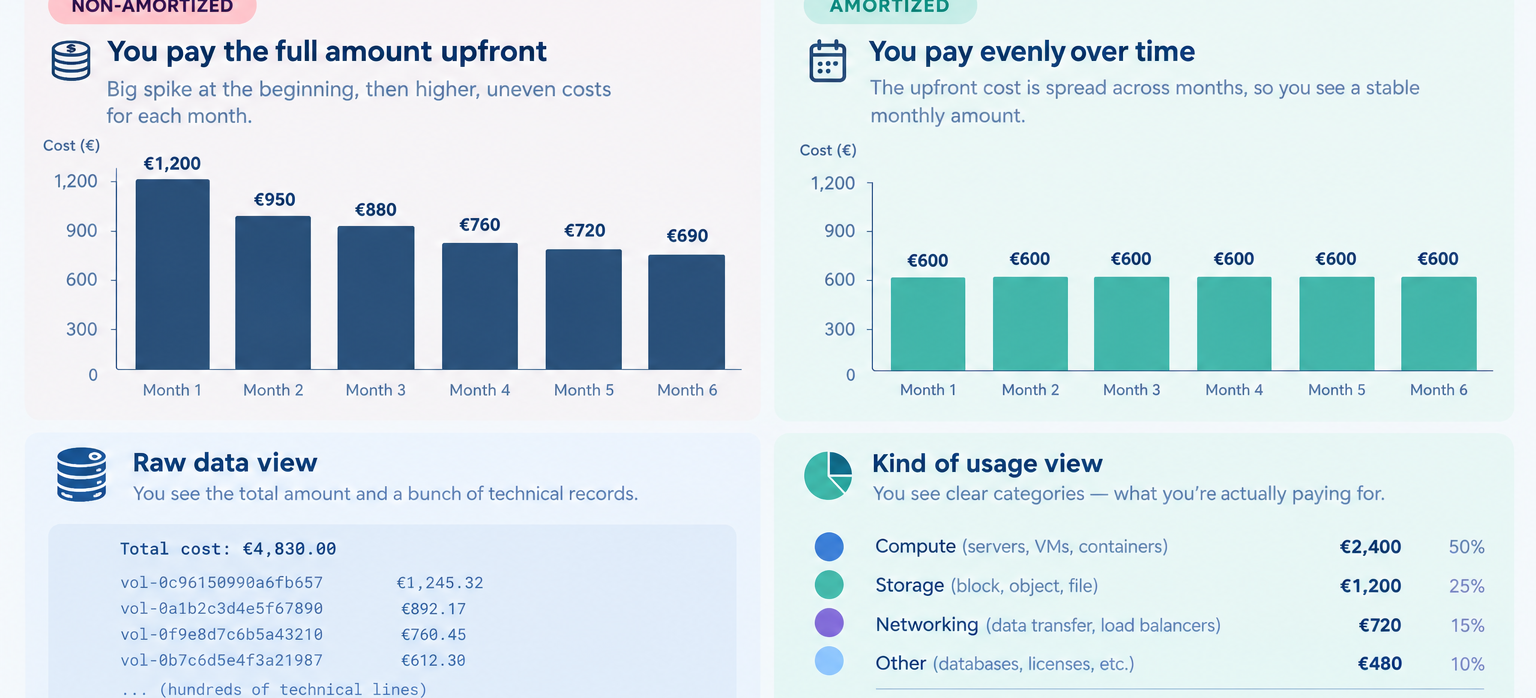
- Non-Amortized (Billed) Costs: This view shows the strict cash-flow reality of your invoice, recording expenses exactly when they occur. If you pay a $120,000 upfront fee for a 1-year Reserved Instance on January 1st, the non-amortized view will show a huge $120,000 cost spike in January and almost no cost for that resource for the next 11 months. While accurate for cash accounting, it distorts operational spending rates.
- Amortized Costs: Amortization spreads the upfront fee evenly over the contract’s life. In the same example, the $120,000 fee would be shown as $10,000 per month. This approach smooths out cost trends and aligns the financial expense with the actual usage of the resource.
Engineering teams often use non-amortized views for daily spend tracking, while finance teams need amortized data for accrual accounting. Without a proper cloud billing solution to reconcile these views, a CFO might see a non-amortized spike, assume a budget overrun, and order unnecessary cuts, not realizing the “spike” was actually a smart, long-term savings purchase.
Why Raw Cloud Billing Data Doesn’t Tell the Whole Story
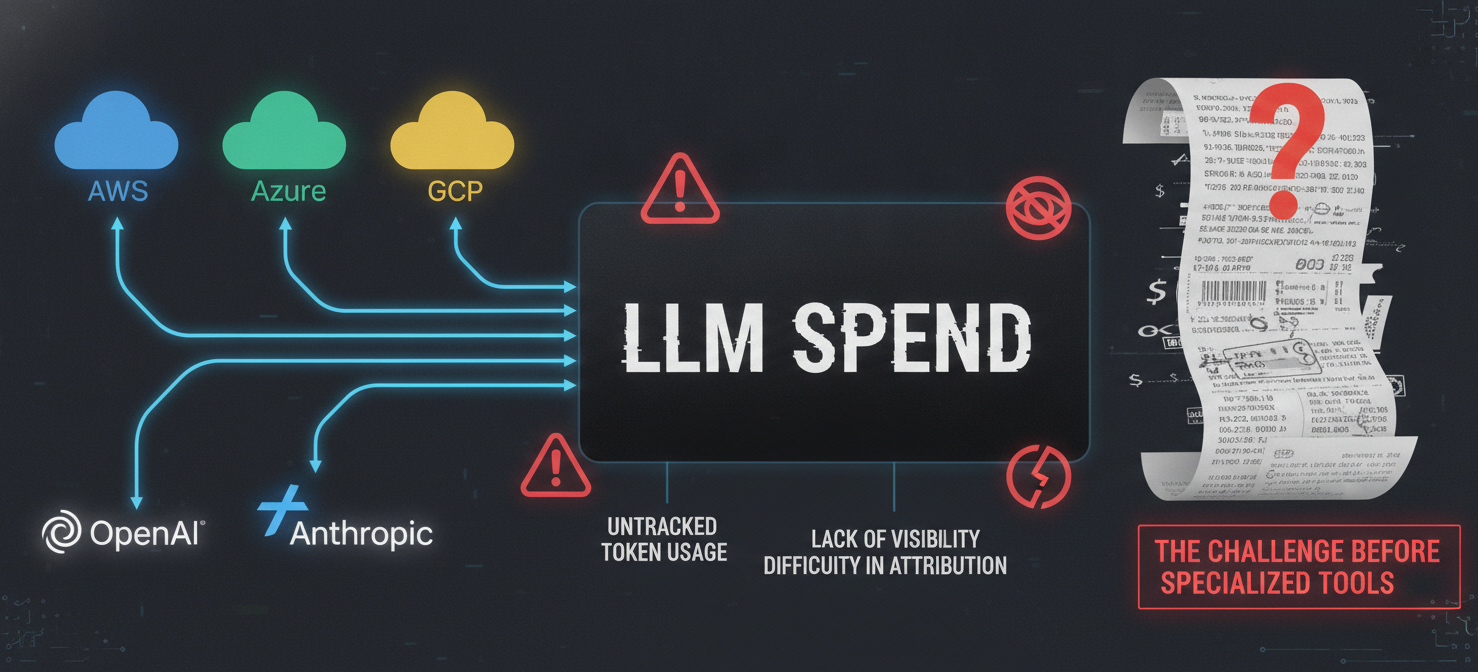
Raw cloud billing data, for all its detail, is incomplete for business management because it lacks essential business context. An invoice lists services and amounts but gives no clue as to which team, application, or customer generated the expense.
The Void of Business Context
Without business context, billing data is just a technical receipt. For a large organization, over 60% of monthly spend might be categorized as “unallocated.” When spend is unallocated, no product owner or department head can be held accountable for it. This lack of structure creates internal friction. An application team might go over budget by 40%, but the raw data offers no way to see which specific microservices caused the overrun.
The Crisis of Untagged Spend
The most obvious sign of this problem is the “untagged spend rate.” In organizations without mature FinOps practices, 30% to 50% of all cloud spend is often completely untagged. Untagged spend comes from resources provisioned without metadata linking them to an owner or cost center. When a large part of the bill is untagged, any report showing “Cost by Team” is fundamentally inaccurate. If 30% of spend is untagged, the maximum possible accuracy of departmental cost allocation is only 70%.
The Containerization Visibility Gap
Furthermore, raw billing data is particularly unhelpful for modern architectures like Kubernetes and containerized microservices. Standard cloud billing reports only show the cost of the underlying virtual machine node (e.g., an EC2 instance). The billing engine cannot see inside the Kubernetes cluster. As a result, it’s impossible to use raw data alone to accurately allocate spending to individual microservices or applications sharing the same node. Without specialized tools to track container-level resource usage, container costs remain a financial black box.
How to Turn Technical Billing Records into Meaningful Cost Categories
To change raw billing data from a confusing mess into useful business intelligence, organizations must implement strong cost attribution and allocation frameworks. Cost attribution is the process of assigning technical cloud expenses to specific parts of the organization, such as product lines, departments, or customer-facing features.
The Foundation: Metadata Tagging
The foundation of cost attribution is metadata tagging. Tags are key-value pairs (e.g., Environment: Production, Team: Core-Backend) attached to cloud resources when they are created. A well-designed tagging strategy is the most important part of the entire FinOps lifecycle. Tags turn raw billing lines into categorized spending, allowing finance teams to create reports that match how the business actually works.
Tagging should be a strict, enforced policy, not an optional guideline. If a resource doesn’t have the required tags, its provisioning should fail. By achieving over 95% tag compliance, organizations can build a reliable foundation for budgeting and forecasting.
Virtual Tagging and Rule-Based Allocation
Even with the best efforts, achieving 100% native tag coverage is nearly impossible. Some cloud services don’t support tagging, and older infrastructure may not have tags. To fix this, organizations use “virtual tagging” tools. These platforms allow FinOps teams to create rules that retroactively allocate costs based on other clues, like account ID or resource naming conventions, without changing the production infrastructure.
Showback and Chargeback Financial Models
Once data is categorized, organizations can use it to create financial accountability through “Showback” or “Chargeback” models.
- Showback: In this model, a central IT or FinOps team provides detailed reports to individual business units showing them how much their cloud consumption costs the company. No money is actually transferred. This helps build cost awareness and empowers engineers to see the financial impact of their decisions.
- Chargeback: This is a more formal model where cloud infrastructure costs are directly deducted from a department’s budget. It creates direct financial accountability. While effective, chargeback can cause friction if the allocation data isn’t trusted as accurate.
By combining tags, virtual allocation, and accountability models, raw billing data becomes actionable. This allows leadership to assess key business metrics like unit economics (e.g., cost per customer), directly linking technology spending to profitability.
How a Cloud Billing Solution Like Binadox Simplifies Cost Visibility
Given the complexity of multi-cloud billing and dynamic pricing, manual analysis with spreadsheets is no longer enough. Enterprises need an integrated, automated cloud billing solution. Binadox is one example of a platform that shows how dedicated FinOps software can simplify cloud cost visibility and governance.
Unified Visibility Across Siloed Environments
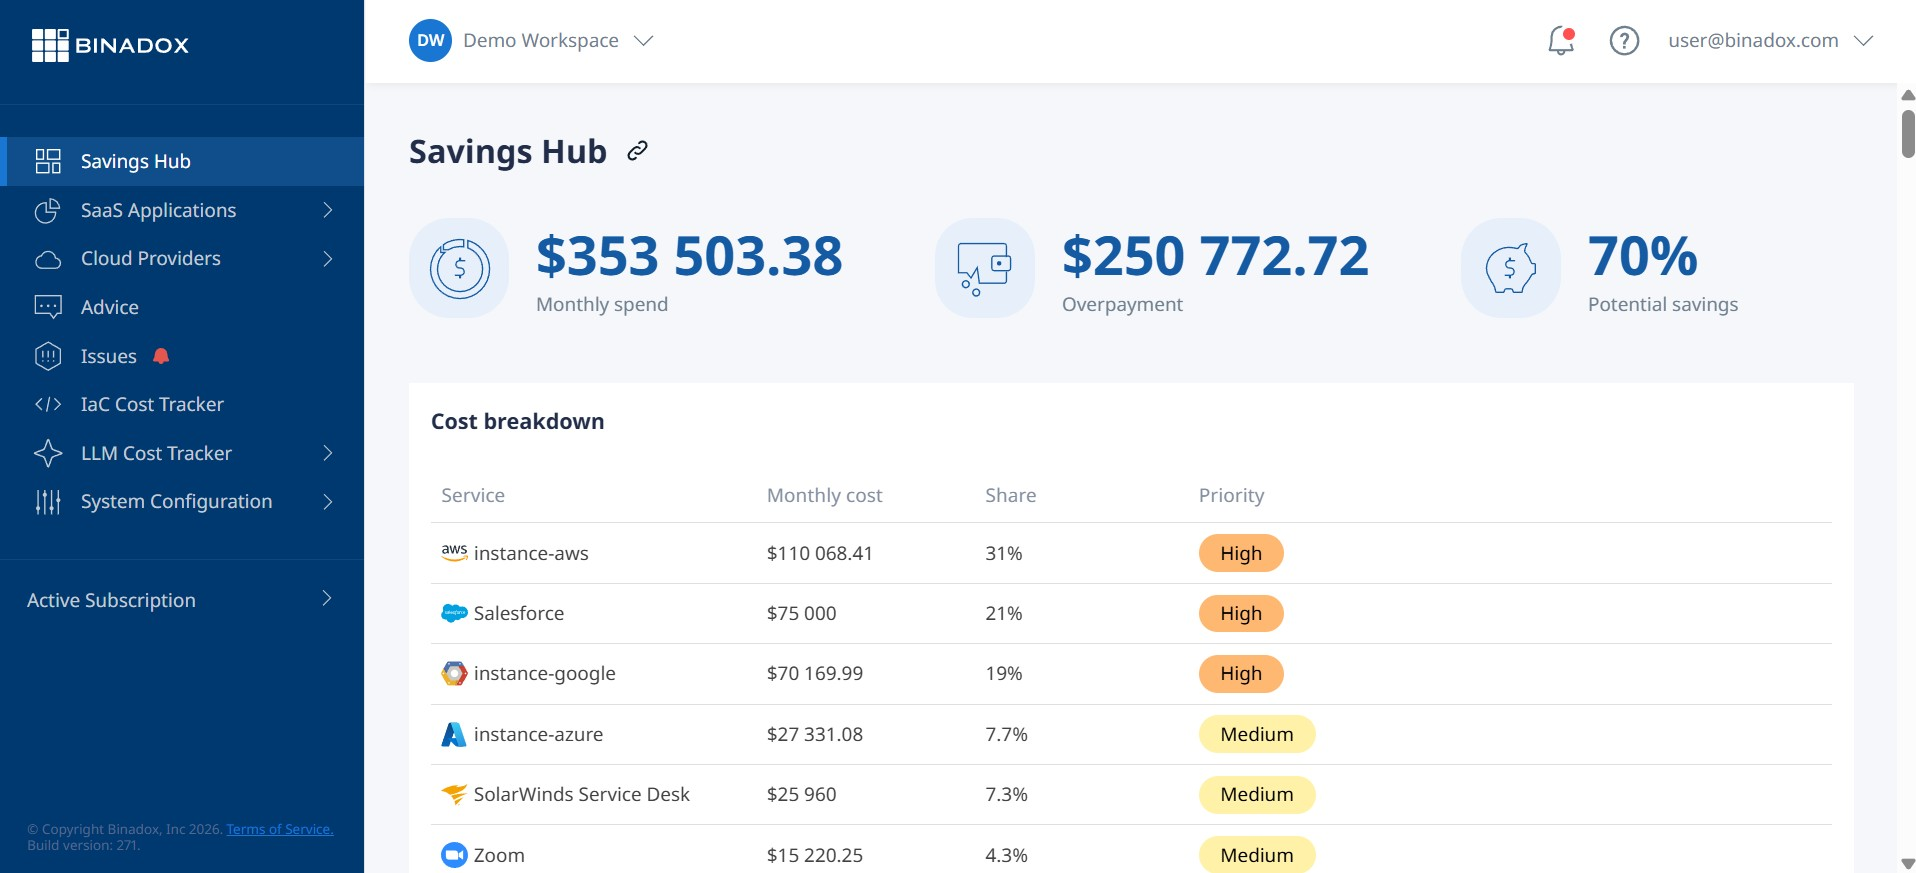
A key benefit of a modern cloud billing solution is its ability to centralize fragmented data. Binadox offers a “single pane of glass” dashboard that gathers and normalizes billing data from AWS, Microsoft Azure, GCP, and other providers. This gives finance teams granular, tag-level spending breakdowns without needing to log into multiple provider portals to reconcile invoices.
Binadox also integrates Cloud Cost Management with Software as a Service (SaaS) spend management. For modern companies, technology spending includes hundreds of SaaS subscriptions. By managing both cloud infrastructure and SaaS portfolios together, platforms like Binadox provide a complete view of total IT expenditure.
Automated Rightsizing and Waste Remediation
A true cloud billing solution must also drive action. Binadox uses analytics to monitor resource usage and automatically find inefficiencies. Its Automated Rightsizing features scan infrastructure to identify idle virtual machines, overprovisioned databases, and orphaned resources like unattached storage volumes. By highlighting these issues and offering automated fixes, Binadox reduces the manual work needed to eliminate cloud waste.
Proactive Anomaly Detection and Budget Guardrails
Because cloud costs can spike unexpectedly, monthly reporting is a major financial risk. Binadox addresses this with real-time Anomaly Detection and custom budget alerts. If a sudden cost increase occurs, the platform sends instant alerts, allowing teams to stop wasteful spending hours or days before the billing cycle ends.
From Raw Billing Data to Actionable Cloud Cost Insights
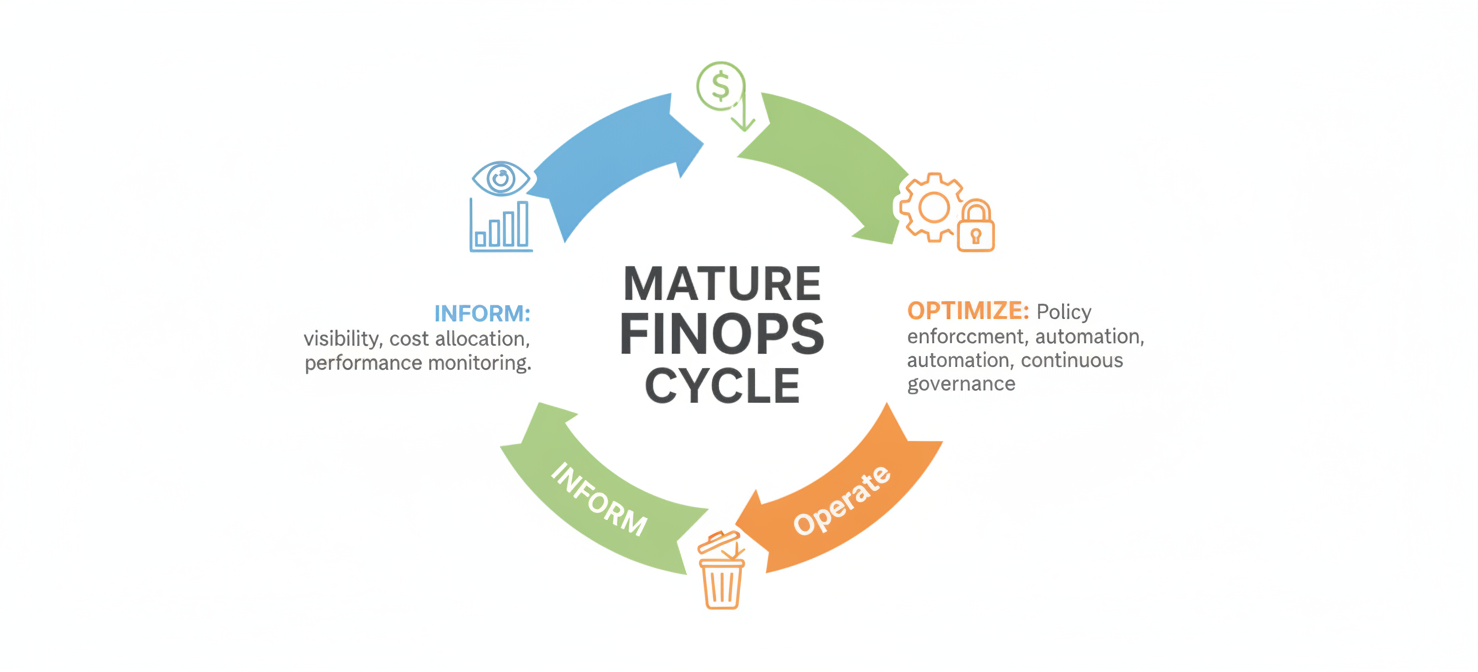
Moving from simply looking at raw data to consistently getting actionable insights is the sign of a mature FinOps practice. This process follows a continuous cycle with three main phases: Inform, Optimize, and Operate.
Phase 1: Inform – Establishing the Baseline
The Inform phase is the foundation. It involves getting complete visibility into cloud spending through standardized tagging, organized account structures, and a central cloud billing solution. The goal is to reach a point where every dollar spent on the cloud can be traced back to a specific team or application. Once this baseline is set, finance teams can create rolling forecasts and budgets to prevent surprise invoices.
Phase 2: Optimize – Identifying and Eliminating Waste
With visibility established, the next phase is to Optimize, which focuses on targeted cost reduction. This usually involves two approaches: architectural efficiency (using less) and rate optimization (paying less).
For architectural efficiency, teams can start with the easiest targets: idle resources. A common 30-day plan begins by finding all compute instances with an average CPU use below 5% over 30 days. Identifying unattached storage volumes and old snapshots can also quickly cut 15% to 20% of wasted budget with little risk.
Next comes “rightsizing.” It’s common for resources to be provisioned for peak loads but run at a fraction of that capacity. For example, average CPU use in unmanaged Kubernetes clusters is often around just 10%. Cloud tools can provide specific recommendations to downgrade instance sizes to match actual usage, which significantly reduces costs.
Rate optimization involves strategically using commitment-based discounts. Organizations can analyze stable usage over a 60-day period and then purchase Reserved Instances or Savings Plans to cover that baseline.
Phase 3: Operate – Institutionalizing Governance
The Operate phase embeds these practices into the company culture. It involves using AI to continuously monitor the environment, enforce governance policies, and track key performance indicators (KPIs). Instead of viewing optimization as a periodic cleanup, this phase integrates financial accountability into daily engineering work.
Key KPIs tracked in this phase include:
- Waste Removed: The percentage of total spend saved.
- Commitment Coverage & Utilization: The percentage of workloads covered by discounts and how well they are used.
- Allocation Coverage: The percentage of cloud spend successfully tagged and attributed (aiming for >95%).
- Forecast Accuracy: The difference between projected budgets and actual invoices.
By cycling through these phases, raw billing data is transformed from a technical problem into a strategic asset.
How to Make Cloud Billing Easier to Understand and Manage
To manage cloud environments effectively, organizations need a mix of structural frameworks, cultural changes, and advanced automated tools. Making cloud billing understandable is an ongoing discipline, not a one-time fix.
Deploy a Unified Cloud Billing Solution
Relying on native provider portals like AWS Cost Explorer is not enough for large organizations, especially those with multi-cloud setups. Native tools are limited to their own ecosystems and often have data delays.
Organizations should deploy a dedicated, third-party cloud billing solution. These platforms connect to all active providers, normalize the data, and present a single, clear reporting interface for both finance and engineering teams. This unification removes the friction of manual data reconciliation.
Implement Financial Guardrails and Alerting
Since cloud provisioning is decentralized, automated guardrails are essential. Organizations must set budget limits for different business units, projects, and environments. When spending approaches a threshold (e.g., 80% of the monthly budget), real-time alerts should be sent via email or platforms like Slack. Advanced platforms can even proactively block the provisioning of expensive resources if a department is far over budget.
Establish a Cloud Center of Excellence (CCoE)
Technology alone can’t solve human challenges. Managing cloud billing requires a dedicated cross-functional team, often called a Cloud Center of Excellence (CCoE) or a FinOps team. According to Flexera, 71% of organizations now have a CCoE, and 63% have dedicated FinOps teams. This team sets tagging standards, leads vendor negotiations, and acts as the translator between engineering and finance.
Conclusion: Understand What You’re Paying for in the Cloud
Mastering cloud economics is no longer optional; it is a requirement for modern business survival. Global spending on public cloud services is projected to reach nearly $850 billion by 2026. As this spending grows, driven by the intense demands of Generative AI, the financial risks of mismanaging cloud infrastructure are higher than ever.
The hard truth is that moving to the cloud does not automatically save money. Without strict governance, it often leads to wasted capital. With current waste rates between 27% and 29%, organizations worldwide are collectively wasting over $182 billion annually on unused or overprovisioned cloud resources.
Your cloud bill is a chaotic document full of technical data. Relying on raw billing exports and manual spreadsheets is a failing strategy that leads to budget chaos and inefficiency. To truly understand what you are paying for, your organization must enforce rigorous tagging policies, shift from reactive analysis to proactive planning, and connect technology consumption to business metrics.
Most importantly, you must equip your teams with a sophisticated, automated cloud billing solution. By deploying a platform that can aggregate multi-cloud data, automate savings, and detect anomalies, businesses can finally remove the confusion from the cloud bill. Only then can you move from just paying for infrastructure to strategically investing in measurable business value.
To truly transform your cloud bill from a chaotic document into a strategic asset, you can experience the clarity of a dedicated solution by initiating a free trial or learn more about its capabilities by scheduling a demo with our experts.
 7-day free trial