


Navigating the financial side of cloud computing can be a major challenge. As your company moves more work to Microsoft Azure, the need for robust azure cloud cost optimization becomes critical. The shift from buying hardware to paying for services monthly offers flexibility. However, it also brings the risk of high operational costs if you don’t monitor them closely. This report explains how to manage your cloud finances, explores Azure’s billing system, and shows how advanced tools like Binadox can help you make smart financial decisions.
Key takeaways
- Research shows that up to 29% of all money spent on the cloud is wasted on underused resources.
- You can reduce your computing costs by as much as 72% by choosing the right deployment regions and using commitment-based pricing like Reserved Instances.
- A layered approach works best, combining native tools like Azure Cost Management with third-party analytics platforms to get a full picture of your spending.
Understanding Azure Billing: How Cloud Costs Are Structured
To achieve effective azure cloud cost optimization, you first need to understand how Microsoft’s billing works. Azure costs are based on a pay-as-you-go model. But the actual billing process uses a complex structure that separates your technical resources from your financial departments.
Azure uses two different hierarchies at the same time: the Resource Hierarchy and the Billing Hierarchy. The Resource Hierarchy is where your technical work happens, and it includes Management Groups, Subscriptions, Resource Groups, and individual resources. On the other hand, the Billing Hierarchy is how Microsoft sends you the bill. This includes Billing Accounts, Billing Profiles, and Invoice Sections. Often, the way you organize your tech doesn’t match your company’s financial structure, like cost centers. Therefore, you must find a way to connect them to track spending accurately.
Enterprise customers also have specific contracts, such as an Enterprise Agreement (EA) or a Microsoft Customer Agreement (MCA). Under these agreements, you might also have a Microsoft Azure Consumption Commitment (MACC), which gives you better prices if you commit to a certain amount of usage.
At the most basic level, Microsoft tracks your usage with “billing meters.” A meter records how much of a resource you use, such as compute hours or storage space. In the past, some meters were shared across different regions. However, a major update in March 2024 introduced unique meter IDs for every service, resource, and region. This change ensures your bill accurately reflects local pricing, which is vital for good cloud cost management azure.
What Drives Azure Costs? Key Factors Affecting Your Cloud Bill
Cloud spending can change a lot based on your technical setup and how your organization works. While the pay-as-you-go model avoids large upfront costs, you can still get a massive bill without careful oversight. Several key factors consistently drive up Azure costs:
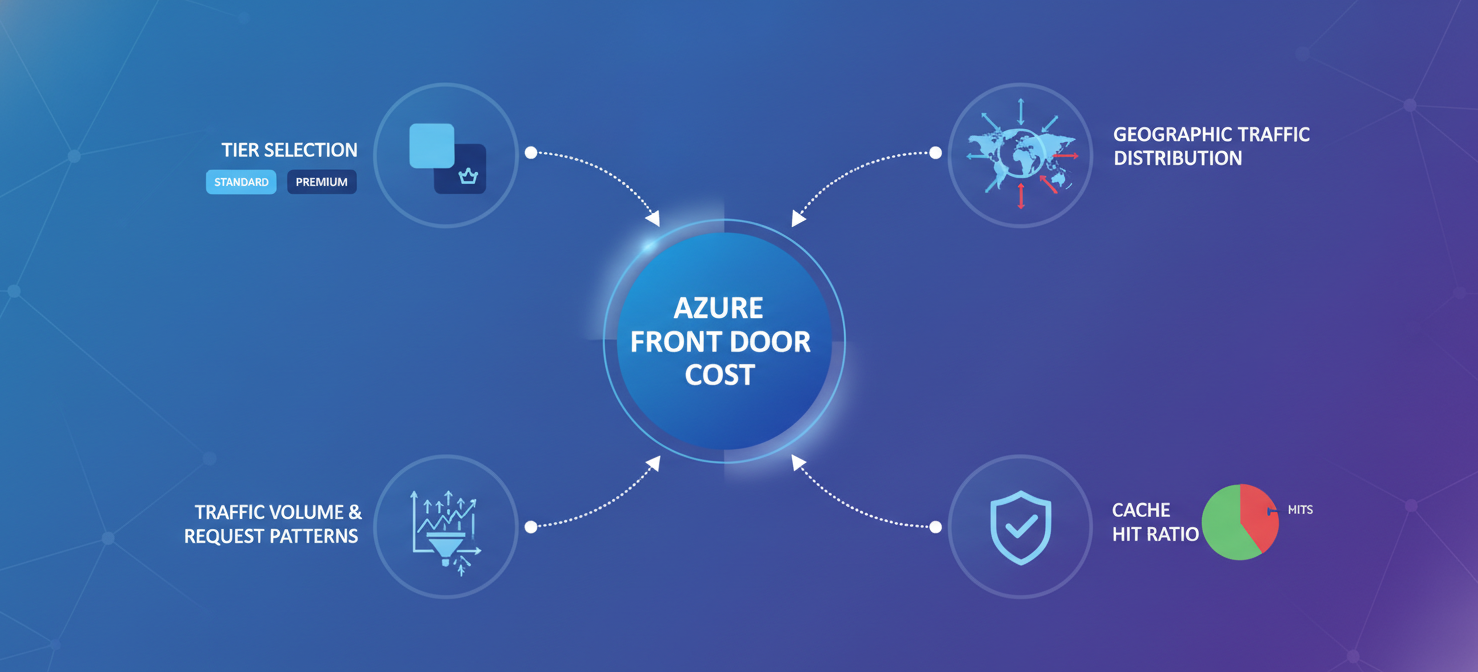
- Type of Resource and Configuration: Different Azure services have different billing methods. For instance, Virtual Machines (VMs) are billed based on their CPU, RAM, and uptime, plus any software licensing fees. In contrast, Azure Functions, a serverless option, are billed based on how many times they run and for how long.
- Consumption and Utilization Constraints: The pay-as-you-go model means you pay for what you provision, not just what you use. A VM that runs 24/7 for a month will be charged for every hour, but using scripts to shut it down during off-hours can significantly cut costs. Similarly, if you run a small workload on a large machine, you are wasting money on unused capacity.
- Geographic Region Placement: Azure has data centers all over the world, and the price for the same resource can vary a lot by region. This is due to local energy prices, taxes, and hardware availability. The price difference between the cheapest and most expensive regions can be substantial.
- Network Ingress and Egress: Moving data into Azure (ingress) is usually free. However, moving data out of Azure to the internet or even to another Azure region (egress) can be expensive. These data transfer fees are often a surprise on cloud bills.
- Maintenance and Resource Lifecycle: A lack of regular cleanup leads to “cloud waste.” Idle or forgotten resources, like unattached premium storage disks or old test environments, keep adding to your bill even though they provide no value.
How Azure Organizes Costs by Service, Resource, and Usage Type
Microsoft organizes its billing data so that you can make sense of millions of individual cost entries. To optimize costs, you need to understand how these line items are classified.
Azure uses a four-level system to structure its cost data:
- Meter Category: This is the broadest classification, such as “Virtual Machines” or “Storage.” It gives you a high-level view of where your money is going.
- Meter Subcategory: This level is more specific, identifying the service plan or family. For example, under “Web Apps,” the subcategory might be “S1” to show it’s a Standard App Service plan.
- Meter Name: This identifies the exact resource attribute being billed. For a VM, the meter name could be “D2 v3 Compute Hours,” which specifies the exact hardware and metric.
- Tags: Since meters only tell you what was used, you need to use tags to explain why it was used. Tags let you add custom labels to resources, like
Environment: ProductionorCostCenter: 1045. This helps you align your cloud bill with your company’s internal financial tracking.
Key Azure Cost Categories: Compute, Storage, Networking, and Databases
A solid approach to azure cloud cost optimization requires you to focus on the “Big Four” areas of spending. Any realistic cost calculation must account for these core components.
Compute
Compute resources are usually the largest part of a cloud bill. Azure offers many types of VMs, including General Purpose, Compute Optimized, and GPU-accelerated instances. The price for compute is mainly driven by uptime. For example, if your team scales up a web application to handle a traffic spike but forgets to scale it back down, you will pay for that unused capacity until someone notices. Simply matching the size of your instances to their actual usage, a practice known as rightsizing, can often cut compute spending by 20% to 40%.
Storage
Storage pricing has many dimensions. It’s not just about how many gigabytes you store; costs are also affected by the storage tier, redundancy level, and the number of transactions.
- Azure Blob Storage: This service has different access tiers. The Hot tier is for data you access often, while the Cool and Archive tiers are for data you access less frequently. Archive storage is very cheap per gigabyte, but it costs more to retrieve the data.
- Managed Disks: Disk types range from standard hard drives to high-performance SSDs, which vary in speed and price. A common source of wasted money is “orphaned disks”—disks that are still being paid for after the VM they were attached to has been deleted.
Networking
Networking services often run in the background but can lead to surprisingly high bills. Key cost drivers include:
- Virtual Network (VNET) Peering: Connecting virtual networks to route traffic privately costs money for both incoming and outgoing data.
- IP Addresses: You are charged a small hourly fee for reserving public static IP addresses.
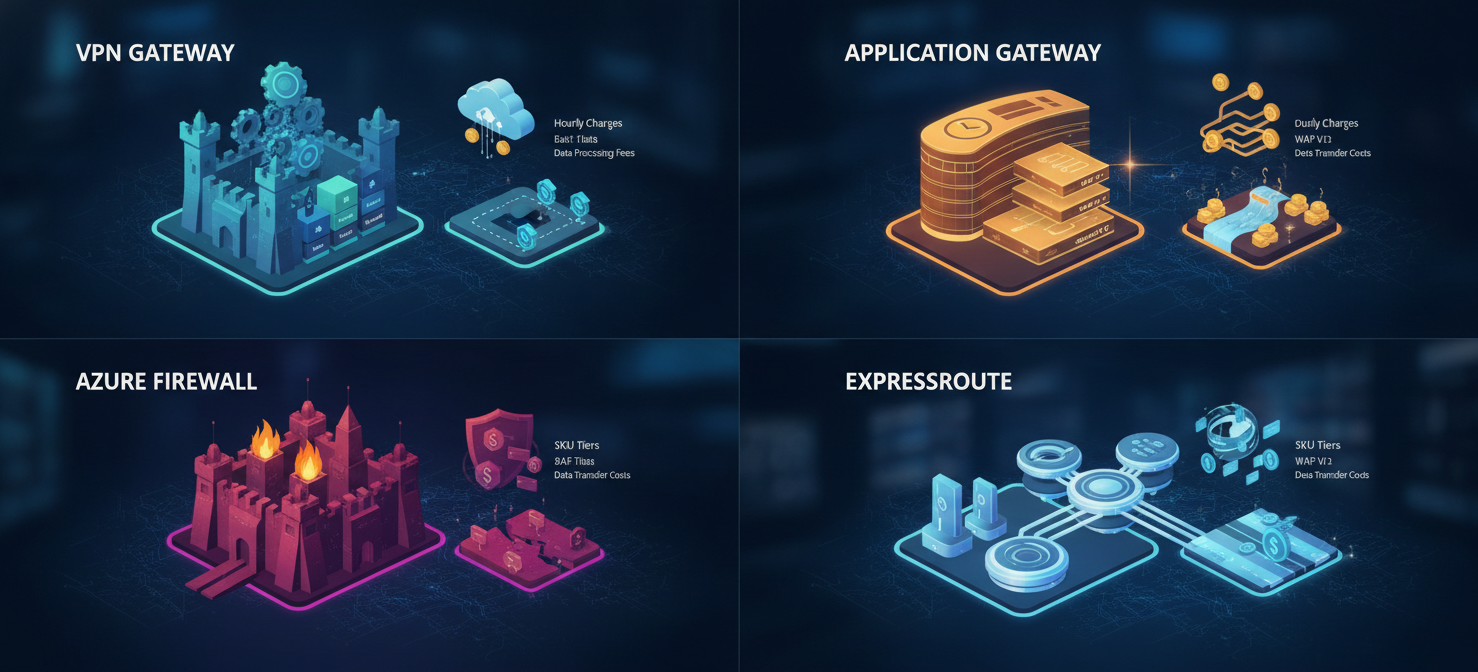
- Advanced Networking Tools: Services like Azure Firewall and Web Application Firewall have their own hourly rates and data processing fees.
Databases
Platform-as-a-Service (PaaS) databases like Azure SQL and Azure Cosmos DB charge for both storage and active compute power. For example, Azure Cosmos DB bills you based on Request Units (RUs), which measure throughput, while SQL databases bill by the number of vCores. Choosing the wrong settings for replication or consistency in Cosmos DB can cause your database costs to skyrocket.
How to Analyze Azure Resource Usage and Billing Charges
To analyze your raw usage data, you need to use Azure’s built-in tools and understand how your applications behave. Microsoft provides the Azure Cost Management + Billing console, which gathers all the data from the billing meters.
Here is how to effectively analyze your charges:
- Access Cost Analysis: In the Azure Portal, go to the Cost Management + Billing section and open Cost Analysis.
- Evaluate Smart Views: Use the pre-built “Smart Views” to see your spending grouped by subscription, resource group, or service. These views make it easier to spot high-level spending patterns.
- Trace Advanced Meters: For complex services like Microsoft Fabric, usage is measured in special units like Capacity Usage (CU). You need to compare these meters with your application logs to ensure costs are allocated correctly.
- Use Azure Copilot: You can ask the built-in AI assistant simple questions to find cost issues quickly. For example, a query like “Which resources are consuming money this month?” can help you find problem areas without building complex reports manually.
How to Identify the Biggest Contributors to Your Azure Spending
Wasted cloud spending is a widespread problem. In 2026, one report estimated that 29% of all cloud spending was wasted, totaling over $182 billion worldwide. To optimize your Azure costs, your FinOps team must find the main sources of this waste.
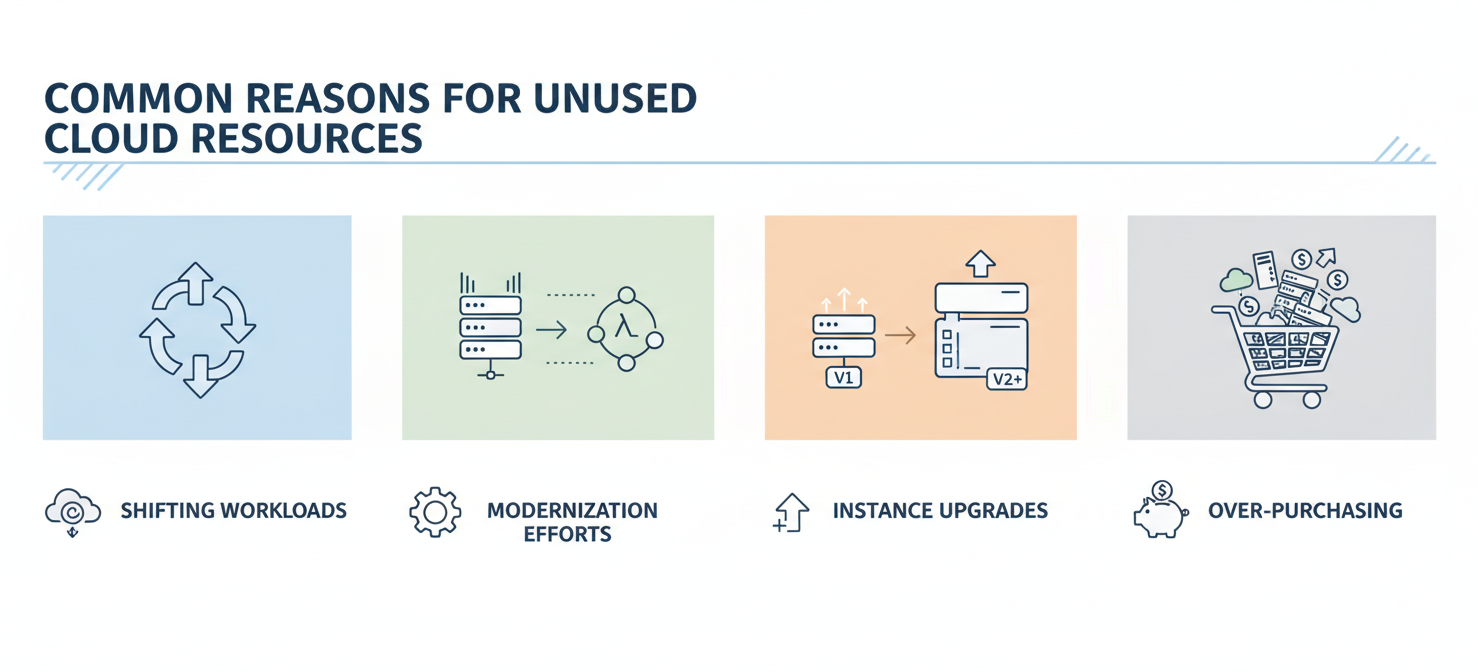
The most common reasons for excessive spending include:
- Idle and Orphaned Resources: Idle compute resources make up about 35% of all wasted cloud money. This includes development and test environments left running over the weekend, abandoned storage accounts, and unattached load balancers.
- Overprovisioned Virtual Machines: Teams often choose larger VMs than they need “just in case,” leading to machines that run at less than 10% CPU usage. This accounts for roughly 25% of all cloud waste.
- AI and Machine Learning Bursts: The rapid adoption of AI has made cloud bills very unpredictable. GPU instances are extremely expensive, and they often run at only 30-40% utilization, creating a new and significant category of waste.
- Cross-Region Data Transfer: Modern applications can sometimes send data between regions unnecessarily, which results in high data egress fees.
Azure Cost Analysis: How to Detect Unexpected Charges and Spending Trends
To prevent budget overruns, you need to move from checking bills after the fact to proactively detecting unusual spending. Budget alerts tell you when you cross a spending threshold, while anomaly alerts tell you when your spending patterns suddenly change.
Azure Cost Management uses machine learning to predict your expected costs. It looks at your spending over the last 60 days to understand your normal patterns, including daily cycles and gradual growth.
How Anomaly Detection Works
- If a resource suddenly behaves differently—for example, if an engineer accidentally creates 20 expensive VMs instead of 2—the system flags it as an anomaly.
- This check runs daily, about 36 hours after the end of the day, to ensure it has a complete dataset for comparison.
- Alerts are then sent to the right people with a summary of the change and a link to the Azure portal to investigate.
In addition to anomaly detection, you should set up automated actions to control costs. You can connect budget alerts to Azure Automation to run scripts that automatically shut down non-production VMs when a budget reaches 80%, creating a financial safety net.
How Azure Pricing Models, Regions, and Resource Configurations Affect Costs
Mastering cloud cost optimization azure involves using the right mix of pricing models and deployment regions that Microsoft offers.
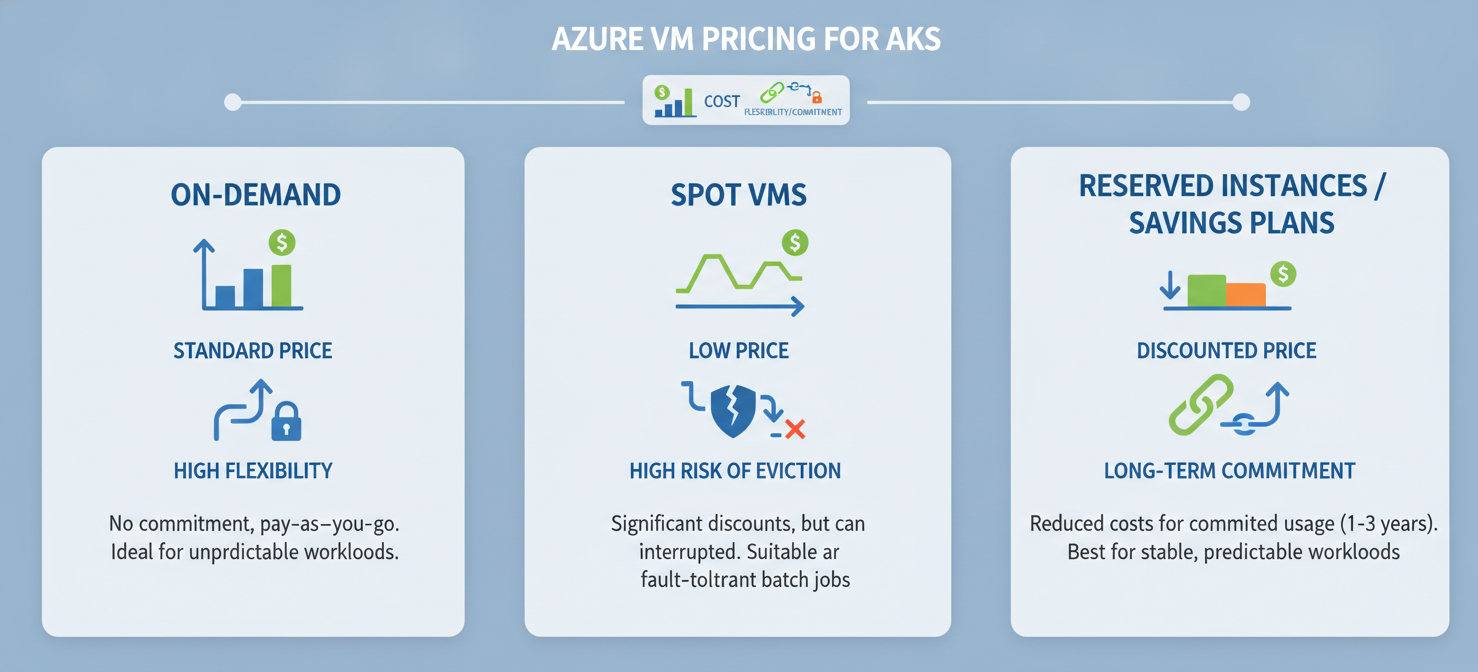
Pricing Models
The default pricing model is Pay-As-You-Go (PAYG), where you pay for what you use with no commitment. While it’s flexible, it is also the most expensive way to use cloud resources. For workloads that run long-term, you can get big discounts:
- Reserved Instances (RIs): If you commit to a 1-year or 3-year term for specific VM types in a specific region, you can get discounts of up to 72%. RIs are perfect for stable, predictable workloads like production databases.
- Azure Savings Plans: These are more flexible than RIs. You commit to a fixed hourly spend (e.g., $20/hour) instead of a specific VM. This gives you discounts of up to 65% on a variety of compute resources, no matter the region or operating system.
- Spot Virtual Machines: For workloads that can be interrupted, like data processing or testing, Spot VMs use spare Azure capacity at discounts of up to 90%. The catch is that Azure can take back the capacity with only a 30-second warning.
Regional Pricing Dynamics
Azure prices its services differently in each region based on local costs for infrastructure, energy, and taxes. As a result, large, established regions like East US and West Europe are generally cheaper. In contrast, newer regions can be much more expensive for the exact same resource.
Global economic factors also affect regional prices. For instance, Microsoft announced price increases for European workloads starting in February 2027. Workloads in Northern Europe will see a 17% increase, while those in Western Europe will face a 9% hike. If your organization uses these regions, you may need to rethink your architecture to keep costs down.
Using Azure Cost Management to Explore and Monitor Cloud Spending
Microsoft provides Azure Cost Management + Billing as a free, built-in tool for anyone involved in managing cloud finances. To use this tool effectively, you should follow several core practices:
| Practice | Description | Value for Optimization |
|---|---|---|
| Budgeting and Forecasting | Create budgets for different scopes, like Management Groups or Subscriptions. The tool uses forecasting to predict your spending for the rest of the month. | Helps prevent surprise bills by alerting you before you go over budget. |
| Role-Based Access Control (RBAC) | Use roles like Cost Management Reader to give people visibility into costs without giving them permission to change resources. | Encourages a culture where engineers take responsibility for the costs of their applications. |
| Advisor Recommendations | Azure Advisor scans your usage to find opportunities for rightsizing and purchasing Reserved Instances. | Automatically finds easy ways to save money, like identifying idle VMs. |
| Power BI Integration | You can export your billing data and connect it to a Power BI template to create custom dashboards. | Allows you to build detailed financial reports for leadership. |
How to Turn Raw Azure Billing Data into Actionable Cost Insights
To truly master azure cloud cost optimization, you need to go beyond just looking at your bill. According to FinOps principles, organizations go through three stages: Visibility, Attribution, and Optimization.
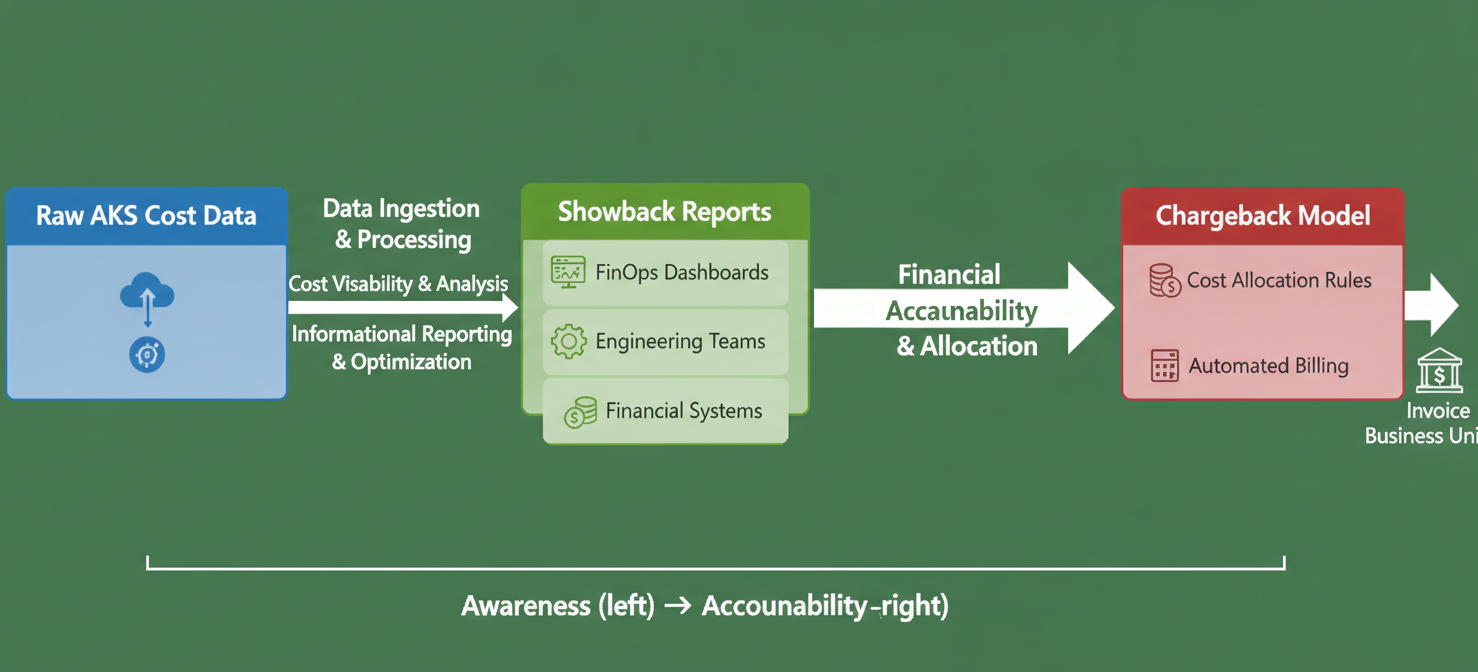
- Stage 1 – Visibility: The first step is to gather all your billing data into one place.
- Stage 2 – Attribution (Cost Allocation): Raw billing data is just a list of resource IDs. To make it useful, you must enforce strict tagging policies to identify which team, application, or environment each cost belongs to. This allows you to accurately charge costs back to internal departments. Without good tagging, many organizations can’t connect cloud costs to specific business units.
- Stage 3 – Optimization: The final stage is to connect your cost data to business metrics, like the infrastructure cost per customer transaction.
Because native tools can sometimes struggle with this level of detail, many companies use specialized third-party software to analyze complex billing data.
How Binadox Kind of Usage Simplifies Azure Cost Analysis
Introduced in October 2026, Binadox Kind of usage is a cost management feature designed to make complex cloud bills from Azure, AWS, and Google Cloud easy to understand.
Raw cloud billing data is incredibly detailed, often containing hundreds of thousands of rows of technical information. For finance and DevOps teams, trying to find out what is driving costs by manually sorting through this data is a slow and difficult task.
The Kind of usage feature removes the need for this manual review. Instead of forcing you to build reports from millions of technical entries, Binadox automatically ingests the raw data and groups it into logical categories. It uses special algorithms to translate confusing technical metrics into a clear, categorized view of your resource consumption.
How to Break Down Azure Costs by Usage Category with Binadox
The real value of Binadox Kind of usage is in its structured reports. The platform breaks down your Azure spending into specific categories, along with helpful financial metrics.
When you analyze your Azure costs in Binadox, the report shows the following columns:
- Kind of usage (Category Name): The specific group Binadox assigns to a cost, often including the billing unit, like
GB-monthsfor storage orvCPU-hoursfor compute. - Volume: The amount of the resource you used during the period, separate from the cost.
- Charged: The gross amount billed by Microsoft for that category before any discounts are applied.
- Credits: Any discounts or credits applied to that category.
- Net: The final amount you have to pay, calculated as
Charged - Credits. - Share of charges: A key metric that shows what percentage of your total bill each category represents. This helps you prioritize where to focus your optimization efforts.
Binadox suggests a top-down approach. First, your FinOps team can look at the “Kind of usage” report to find categories with a high “Share of charges.” Once you identify a costly area, you can switch to the “Raw data” view to dig into the individual resources and find the root cause of the spending.
Best Practices for Azure Cost Monitoring and Optimization
Getting the most value from your cloud investment and reducing the typical 29% of wasted spend requires a disciplined approach. An effective azure cloud cost optimization strategy should include the following practices:
- Implement Aggressive Shutdown Schedules: Non-production environments like development and testing don’t need to run 24/7. Automating shutdowns for nights and weekends can cut their compute costs by about 65%.
- Continuously Rightsize Compute: Don’t wait for quarterly reviews to resize your resources. Use Azure Advisor or other tools to constantly monitor for VMs with low CPU usage and downsize them.
- Deploy Azure Policy for Governance: Don’t rely on people to follow the rules. Use Azure Policy to create automated guardrails. For example, you can restrict which VM sizes developers can use, limit deployments to cheaper regions, and require all resources to be tagged.
- Execute Routine Storage Cleanup: Wasted storage costs can add up quietly. Set up lifecycle policies to automatically move old data to cheaper storage tiers. Regularly check for and delete orphaned disks and old snapshots.
- Strategically Use Commitments: Once your workloads are optimized, figure out your baseline usage. Use Reserved Instances and Savings Plans to cover this predictable usage to get discounts of 65-72%.
- Embrace Spot Capacity: For containerized applications or batch processing, use Spot node pools. While there is a risk that your VM could be shut down with little warning, this forces you to build more resilient applications and can save you up to 90% on costs.
Conclusion: Improve Azure Cost Visibility with Usage-Based Billing Analysis
The cloud gives your teams incredible speed, but that speed can often outrun your financial controls. The complexity of Azure’s pricing, consumption models, and billing meters creates an environment where waste can easily grow. With global cloud waste approaching $182 billion a year, driven by oversized infrastructure and expensive AI projects, implementing a rigorous azure cloud cost optimization strategy is no longer optional; it’s a business necessity.
Gaining control requires a shift from simply reviewing bills to proactively analyzing usage-based data. Native tools like Azure Cost Management provide a solid foundation with budgets and alerts. However, to reach true financial maturity, you often need more advanced tools. Features like Binadox’s Kind of usage fill the gap between raw technical data and clear financial insights. By turning confusing billing files into logical, categorized reports, your organization can quickly find cost drivers, make targeted improvements, and ensure every dollar spent in Azure delivers real business value.
To move beyond reactive bill reviews and proactively optimize your Azure spend, Binadox offers the clarity you need. Discover its power by engaging with a free trial or scheduling a personalized demo to transform your cloud financial management.
 7-day free trial