


Amazon CloudWatch is an essential monitoring service for any team running applications on AWS. It provides the data and actionable insights needed to keep your systems running smoothly. However, without careful management, the associated expenses can quickly escalate. Understanding the drivers behind your AWS CloudWatch costs is the first step toward effective cloud cost management. This article explains the billable components of CloudWatch and describes how to analyze your usage to identify and control spending.
Key takeaways
- CloudWatch pricing is multi-dimensional, with separate charges for metrics, logs, alarms, and more.
- Custom metrics are a primary cost driver, with the first 10,000 priced at $0.30 per metric per month.
- Log data generates costs for ingestion ($0.50/GB), storage ($0.03/GB/month), and analysis.
- Tools like Binadox can simplify cost analysis by categorizing raw billing data and identifying spending anomalies.
Understanding Amazon CloudWatch Pricing
CloudWatch uses a pay-as-you-go model with no upfront fees. You are billed for what you use across several distinct categories. While AWS provides a free tier for many of these services, production workloads often exceed these limits, leading to monthly charges.
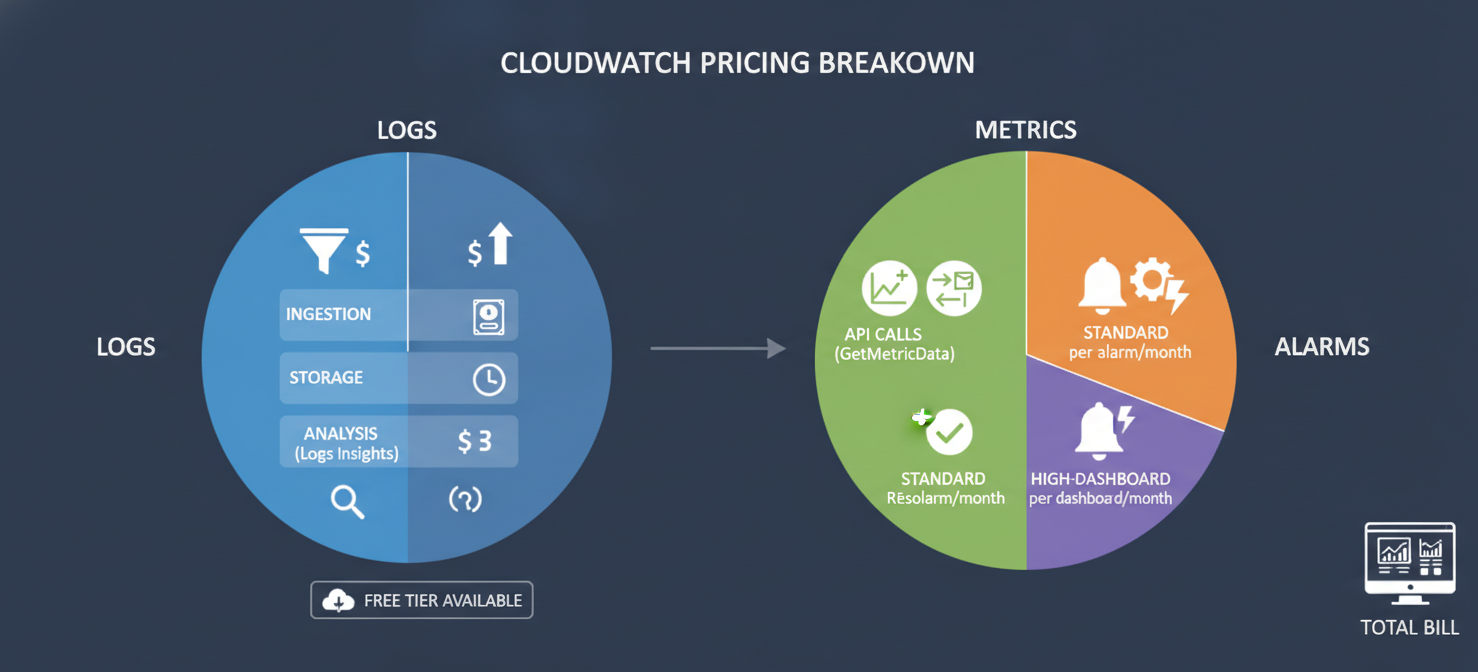
The main components of CloudWatch pricing include:
- Metrics: Collecting and tracking performance data.
- Logs: Ingesting, storing, and analyzing log data.
- Alarms: Notifying you when specific thresholds are breached.
- Dashboards: Visualizing your metrics and logs.
- API Usage: Programmatic requests made to the CloudWatch service.
Each of these has its own pricing structure, often with tiered rates that decrease as your usage increases. For example, the cost per custom metric drops significantly after the first 10,000. This complexity makes cost management in the AWS cloud a significant challenge for many organizations.
How Custom Metrics, Logs, and Queries Generate Costs
The bulk of many CloudWatch bills comes from metrics and logs. Understanding how these services accrue charges is fundamental to managing your overall spend.
Custom Metrics Costs
Standard metrics from many AWS services are free. However, custom metrics, which you publish from your own applications or scripts, come at a cost. The price for the first 10,000 custom metrics is typically $0.30 per metric per month. This can add up quickly. For instance, enabling detailed (1-minute) monitoring on EC2 instances converts standard metrics into billable custom metrics, which could add over $1,000 per month for a fleet of 500 instances.
In addition to the per-metric fee, API requests like PutMetricData also incur charges, usually around $0.01 per 1,000 requests. High-frequency metric publication can therefore increase costs for both the number of metrics and the volume of API calls.
Log Ingestion and Storage
CloudWatch Logs pricing has three main components: ingestion, storage, and analysis.
- Ingestion: You are charged for the amount of log data sent to CloudWatch. The standard rate is often around $0.50 per GB ingested.
- Storage: Storing logs also has a monthly cost, typically about $0.03 per GB for standard access. AWS also offers an Infrequent Access log class at a lower storage cost.
- Analysis: Running queries on your logs using CloudWatch Logs Insights is another billable dimension, priced per GB of data scanned.
The volume of log data can be a major factor in your AWS CloudWatch costs, especially for verbose applications or large-scale systems.
Alarms, Dashboards, and Other Billable Features
While metrics and logs are often the largest cost drivers, other CloudWatch features contribute to your monthly bill and require attention.
Alarm Pricing
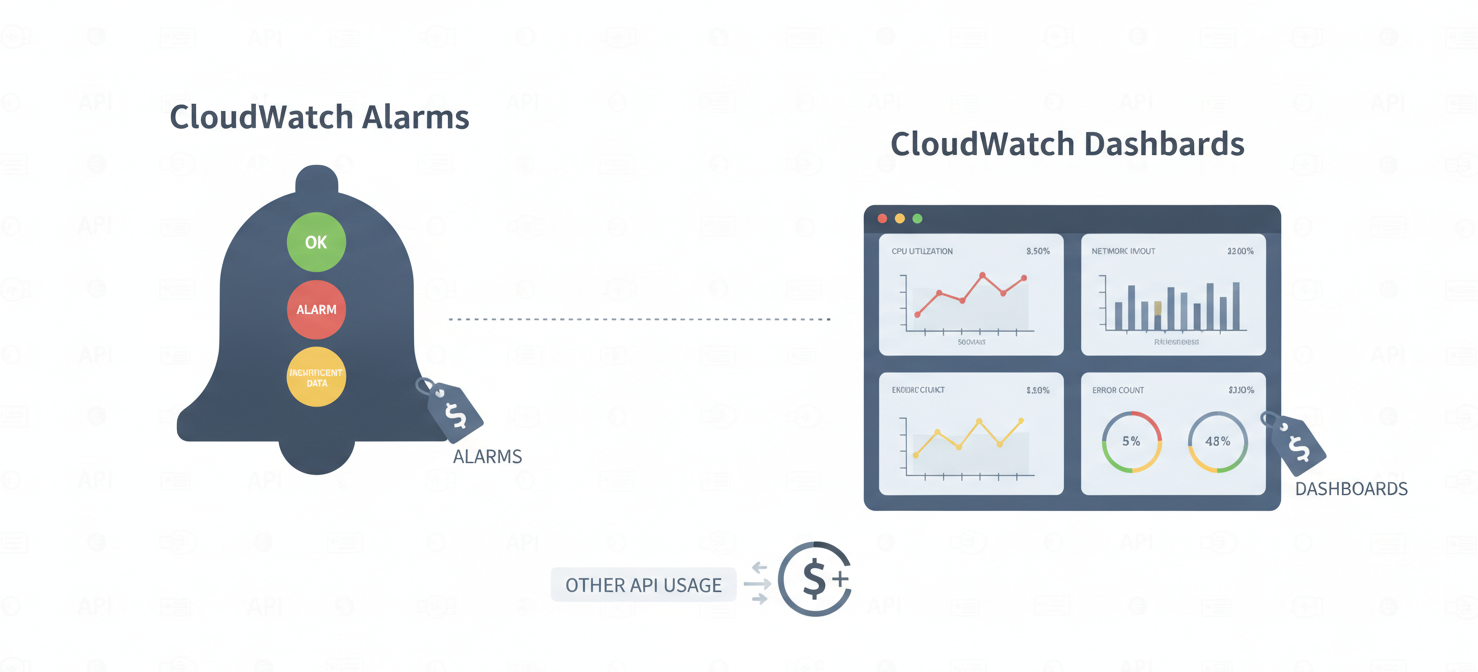
CloudWatch Alarms are billed based on the number of alarms and their resolution. A standard-resolution alarm (checked every 60 seconds) costs $0.10 per month. High-resolution alarms, which check metrics more frequently, cost more. Composite alarms, which combine the states of multiple other alarms, have their own pricing at $0.50 per alarm per month.
Dashboard Costs
While the automatic dashboards provided by AWS are free, custom dashboards are not. You are charged a monthly fee for each custom dashboard you create, typically around $3.00 per dashboard. API requests made by dashboards to retrieve metric data can also contribute to costs.
How to Interpret CloudWatch Usage Metrics and Billing Records
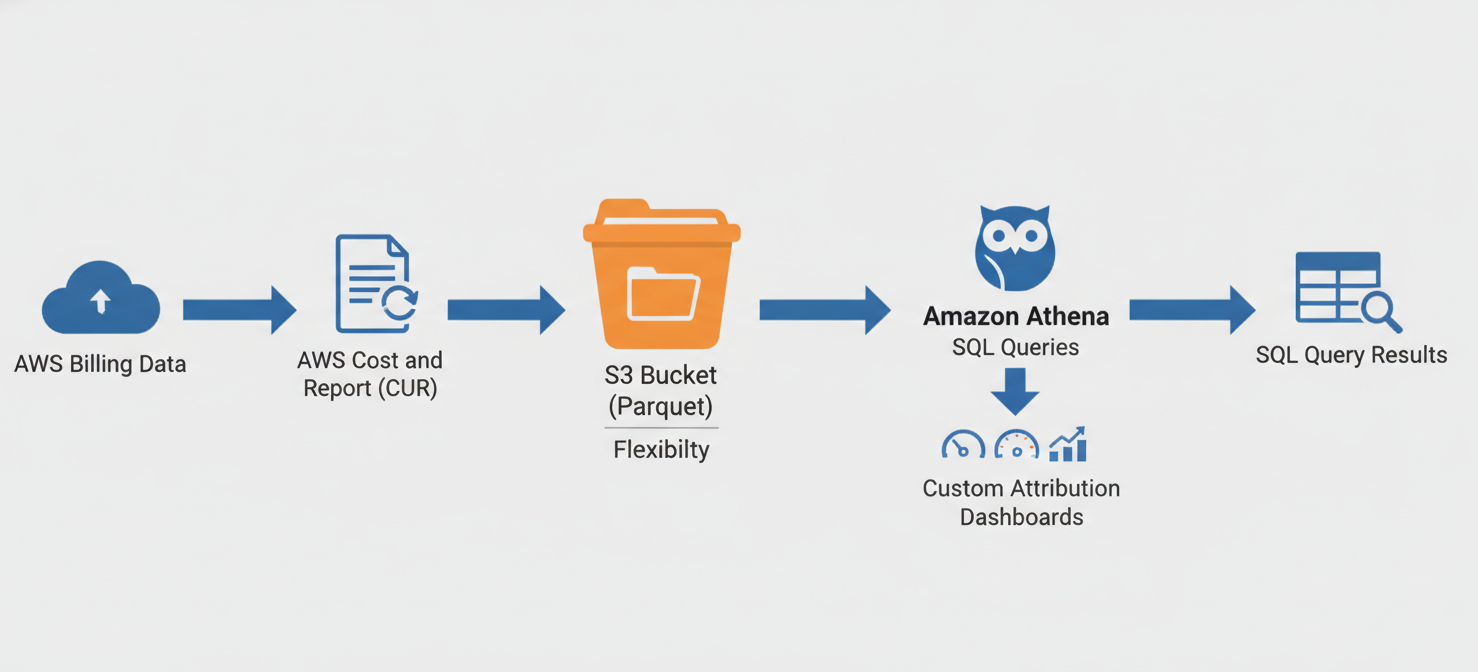
To manage your spending, you first need visibility. AWS provides tools to help you understand your bill. The AWS Cost and Usage Report (CUR) offers a comprehensive set of data about your consumption. You can use services like Amazon Athena to query this report and break down your CloudWatch spending by usage type, such as CW:MetricMonitorUsage or VendedLog-Bytes.
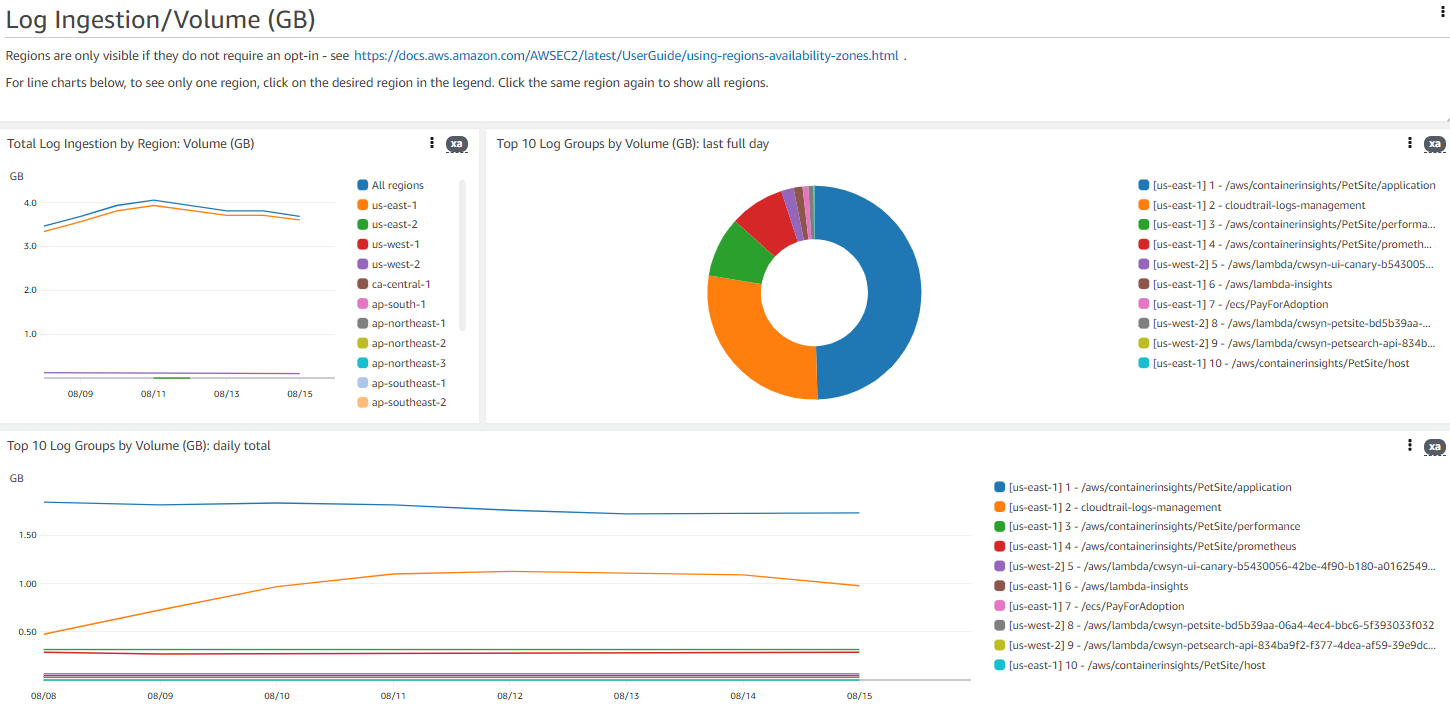
Analyzing these reports helps you pinpoint which services are driving costs. For example, a high value for DataProcessing-Bytes could indicate that you are ingesting a large volume of logs, prompting a review of your logging levels and retention policies.
How to Find Costly Monitoring Configurations
Once you understand your billing data, you can investigate your AWS environment to find the specific configurations causing high costs.
Start by examining your custom metrics. Are there metrics being published that are no longer needed? Sometimes, development or temporary metrics are left running, needlessly inflating your bill. Similarly, review your EC2 instances and other resources. Is detailed monitoring enabled where it isn’t necessary?
For logs, look at the log groups with the highest ingestion volumes. Analyze the log sources to see if the verbosity can be reduced without losing critical information. You can also implement log filtering to send only relevant events to CloudWatch. Setting appropriate retention policies is another key step; storing logs indefinitely is rarely necessary and leads to ever-increasing storage costs.
How Binadox Helps Analyze CloudWatch Costs
While native AWS tools are useful, third-party cloud cost management platforms like Binadox can provide deeper insights more quickly. Binadox helps you interpret complex AWS billing data by automatically categorizing your spending and providing clear, interactive dashboards.
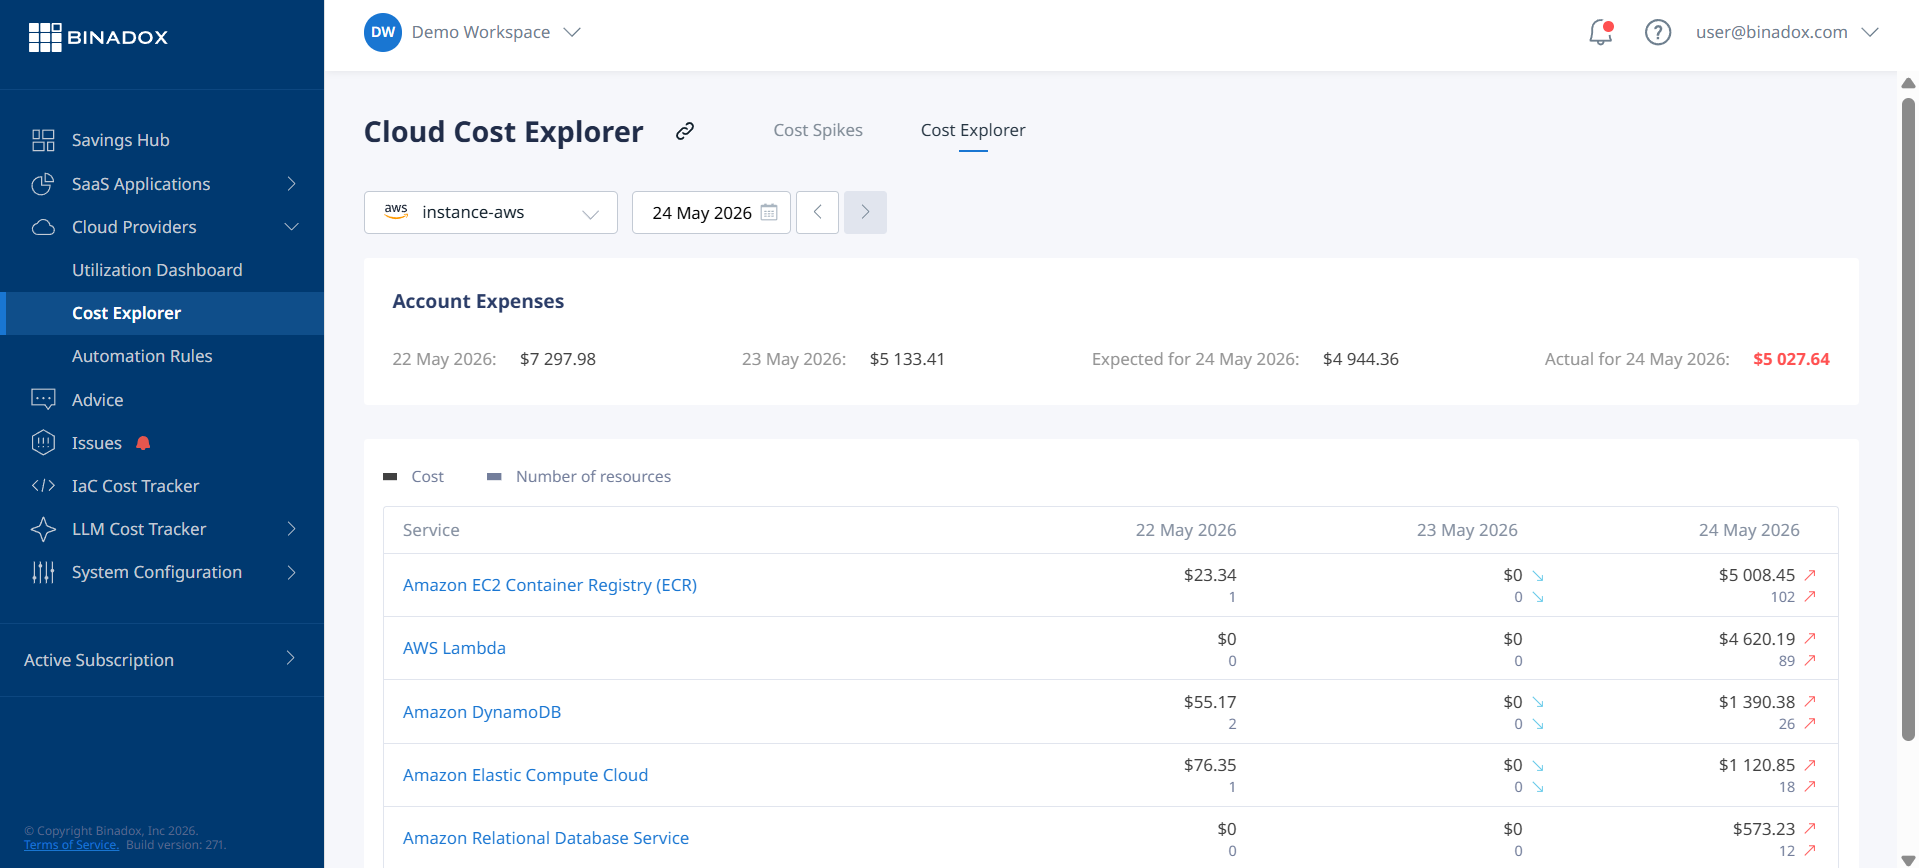
Instead of manually querying usage reports, you can use a tool like Binadox Cost Explorer to get real-time visibility into your cloud spending. It can identify cost anomalies and spending spikes, allowing you to investigate and resolve issues before they significantly impact your budget. By transforming raw billing data into actionable insights, Binadox makes it easier to identify the specific services, projects, or teams responsible for high CloudWatch costs.
Best Practices for Controlling Monitoring Expenses
Effective cost management for the AWS cloud involves a continuous process of monitoring, analysis, and optimization. Here are some best practices:
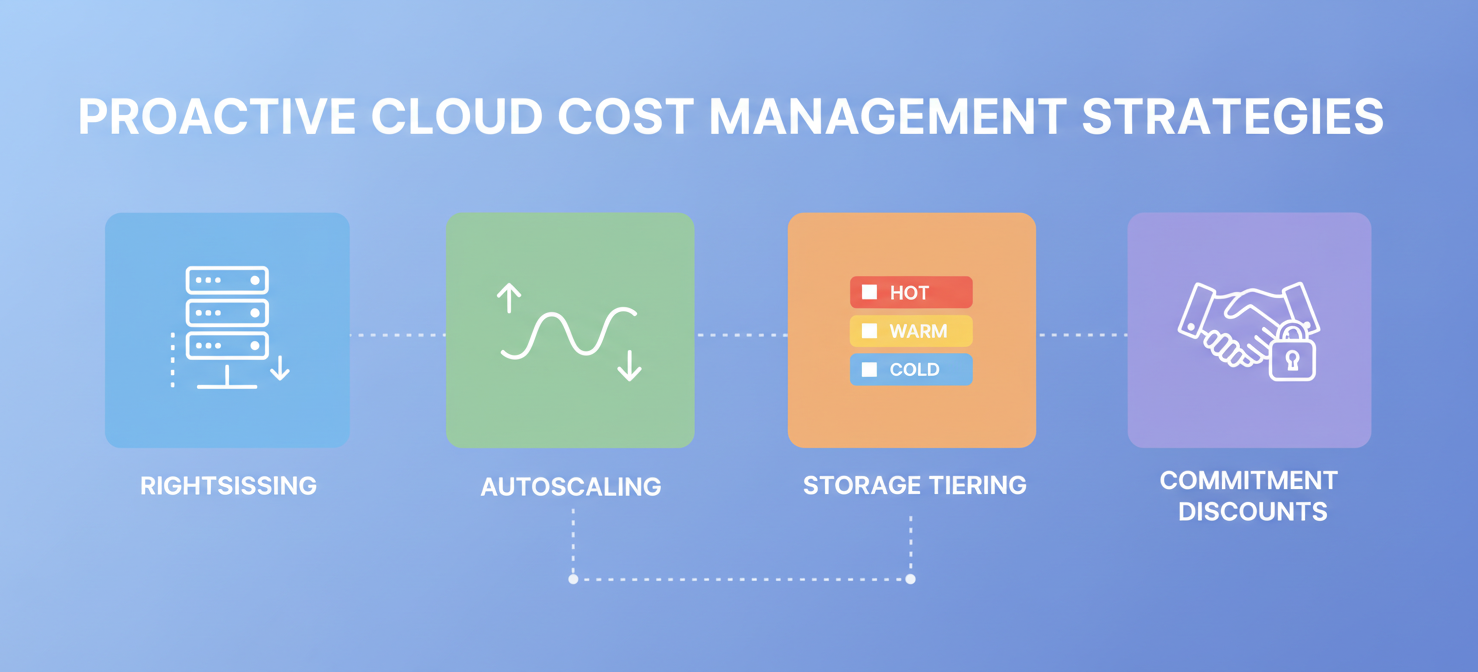
- Right-Size Your Monitoring: Continuously evaluate your metrics and alarms. Remove any that are redundant or no longer provide value. Ensure you are using standard-resolution monitoring unless high-resolution is explicitly required.
- Optimize Log Management: Set appropriate log retention policies to avoid paying for long-term storage of non-essential data. Use log filtering and adjust application logging levels to reduce the volume of data ingested.
- Use Tagging: Implement a consistent tagging strategy for your AWS resources. Tags allow you to allocate costs to specific projects, teams, or environments, which is crucial for accountability and detailed analysis.
- Set Budgets and Alerts: Use AWS Budgets to set spending thresholds and receive alerts when your costs are forecasted to exceed your budget. This provides an early warning system to prevent billing surprises.
- Leverage Cost Management Tools: Employ cloud financial management tools to gain better visibility and control over your spending. These tools can automate much of the analysis and provide optimization recommendations.
By combining these strategies, your team can maintain the deep visibility that CloudWatch provides without letting costs spiral out of control.
In conclusion, managing AWS CloudWatch costs requires a clear understanding of its pricing model and a proactive approach to monitoring your usage. The key is to treat observability costs not as a fixed overhead but as a variable expense that can be actively managed and optimized. By regularly analyzing your metrics, logs, and other billable components, you can ensure that you are only paying for the monitoring data that delivers real value. After all, a monitoring service that breaks the bank isn’t a very good monitoring service.
If you’re ready to take control of your monitoring expenses, you can explore Binadox’s capabilities by beginning your free trial or arranging a personalized demo.
 7-day free trial