Support Search

Cloud Cost Optimization
An illustration of a startup CTO using a digital dashboard to monitor and control cloud spending, symbolizing effective GCP cost control for startups and extending financial runway through proactive management of infrastructure costs.
Published July 10, 2026
Your cloud bill arrives. It’s 10x what you expected. A developer ran a test on a massive instance and forgot about it. A data pipeline had a ...
Cloud Cost Optimization
~6 minutes
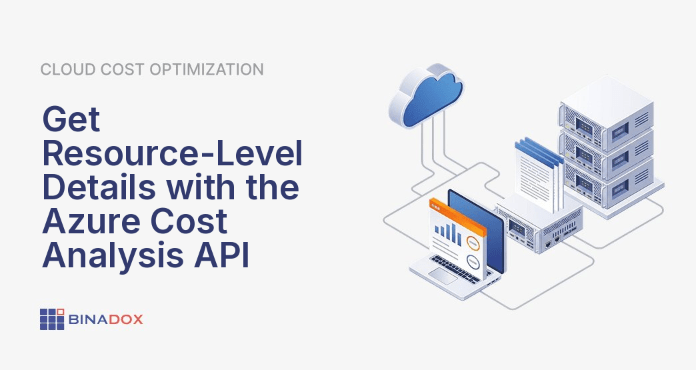
An intricate dashboard illustrating Azure cost analysis API resource details, showing how programmatic access can break down cloud spending to individual virtual machines, storage accounts, and databases for precise optimization and financial management.
Published July 10, 2026
Cloud Cost Optimization
~4 minutes
An illustration comparing reserved instance vs savings plan, showing Reserved Instances as a rigid, deeply rooted tree offering high, specific discounts, and Savings Plans as a flexible river covering broad usage with consistent savings. This visual metaphor highlights the trade-off between specificity for maximum savings and flexibility for adaptable cloud cost management.
Published July 10, 2026
Cloud Cost Optimization
~4 minutes
An illustrative diagram representing effective kubernetes cost optimization strategies within an Azure environment, showing a downward trend in expenses and efficient resource allocation.
Published July 10, 2026
Cloud Cost Optimization
~7 minutes
A digital illustration depicting a steep, upward-trending red line on a financial graph, symbolizing an unexpected Aurora Serverless v2 cost increase. In the foreground, a person with a puzzled expression holds a tablet displaying a high bill, set against a backdrop of cloud infrastructure icons, highlighting the common issue of rising cloud database expenses despite expectations of savings.
Published July 10, 2026
Cloud Cost Optimization
~6 minutes
An illustration depicting a cloud server rack with several servers that appear to be powered down or inactive, yet a visible power meter connected to the rack continues to register increasing charges. This visual metaphor highlights how GCP charges for inactive projects, specifically for provisioned resources that incur costs even when not actively processing data, leading to unexpected bills.
Published July 10, 2026
Cloud Cost Optimization
~4 minutes
An illustration depicting the flow of data from Azure Kubernetes Service (AKS) pods through a filtering mechanism, leading to a reduced cost meter, symbolizing effective management of AKS log analytics costs.
Published July 10, 2026
Cloud Cost Optimization
~4 minutes
An illustration depicting the process of simplifying and optimizing complex AWS billing, symbolizing a practical aws cost optimization guide that brings clarity and control to cloud spending.
Published July 10, 2026
Cloud Cost Optimization
~5 minutes
An illustration showcasing a comprehensive cloud cost comparison, with elements representing AWS, Azure, and Google Cloud, alongside financial charts and a magnifying glass over a complex bill, symbolizing the process of optimizing cloud spending for predictability.
Published July 10, 2026
Cloud Cost Optimization
~6 minutes
1…1112131415…190

Get started now

Minimize the cloud costs. Maximize the business value.
7-day free trial
Full platform access
Cancel anytime