Support Search

Blog

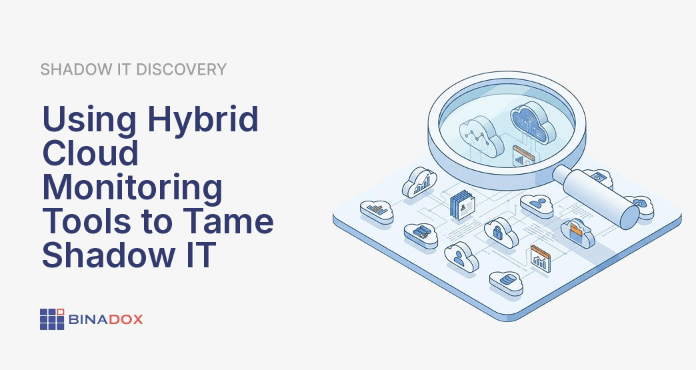
A sophisticated digital illustration depicting a unified dashboard overseeing a complex hybrid cloud infrastructure. On-premises data centers and multiple public cloud platforms are interconnected, with data streams flowing into a central monitoring interface. This visual metaphor highlights how hybrid cloud monitoring tools provide comprehensive visibility and control over diverse IT environments, essential for managing shadow IT and ensuring operational efficiency.
Published July 10, 2026
The rise of hybrid and multi-cloud environments gives your teams incredible flexibility. However, it also creates complexity. When employees find official IT processes too slow, they often ...
Cloud Cost Optimization
~5 minutes
An IT administrator looking frustrated at a computer screen displaying a Microsoft 365 admin center dashboard where Office 365 licenses are unassigning automatically for several users, indicated by fading license icons and error messages, highlighting the common issue faced by organizations.
Published July 10, 2026
SaaS Cost Management
~4 minutes
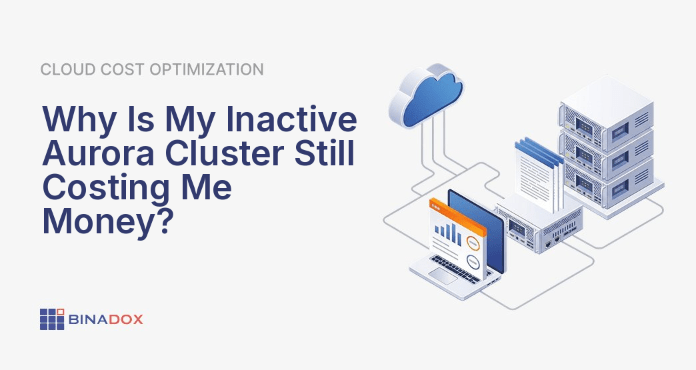
An illustration showing an inactive Aurora cluster, visually represented as a stopped database with a subtle stream of money flowing from its storage component, highlighting the hidden costs even when compute instances are paused. This image emphasizes why an inactive Aurora cluster can still incur charges.
Published July 10, 2026
Cloud Cost Optimization
~4 minutes
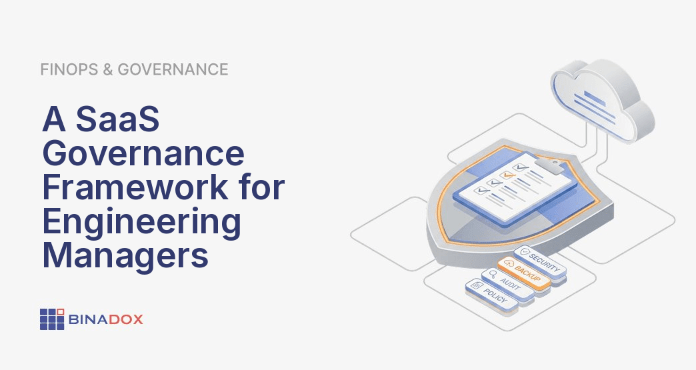
An engineering manager uses a SaaS governance framework to bring order to a sprawling, chaotic landscape of interconnected software-as-a-service applications, symbolizing control over budget, security, and operational efficiency.
Published July 10, 2026
SaaS Cost Management
~6 minutes
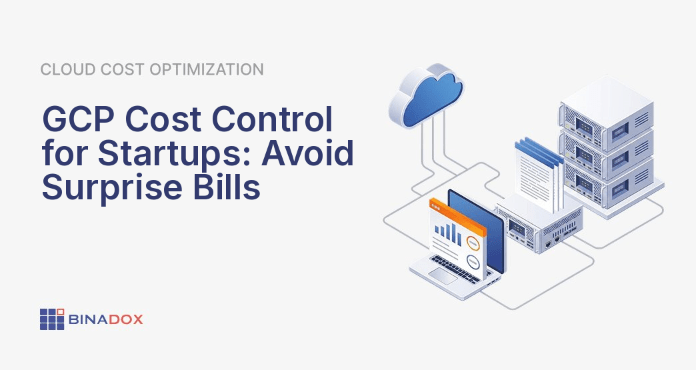
An illustration of a startup CTO using a digital dashboard to monitor and control cloud spending, symbolizing effective GCP cost control for startups and extending financial runway through proactive management of infrastructure costs.
Published July 10, 2026
Cloud Cost Optimization
~6 minutes
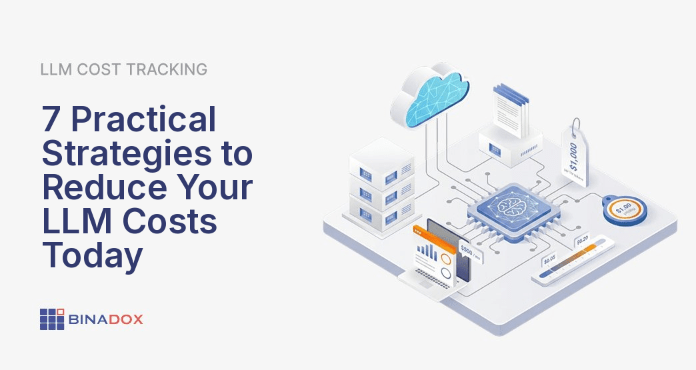
An illustrative infographic demonstrating multiple strategies to reduce LLM costs, including prompt optimization, model routing, caching, and monitoring. The image visually represents how these techniques collectively bring down the financial burden of large language model operations, ensuring sustainable AI development.
Published July 10, 2026
LLM Cost Management
~5 minutes
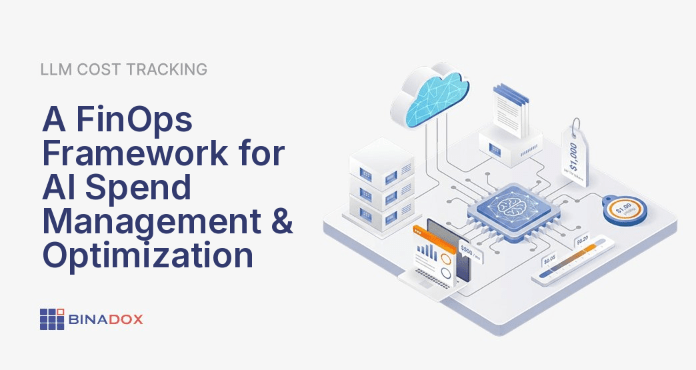
An abstract digital illustration representing FinOps for AI spend management, showing complex AI infrastructure and data streams on one side, flowing into clear financial dashboards and cost allocation models on the other. A transparent FinOps framework overlays the scene, symbolizing control and visibility over volatile AI expenditures. This visual metaphor highlights the process of transforming opaque AI costs into actionable financial insights for FinOps leads and cost analysts.
Published July 10, 2026
FinOps & DevOps Practices
~6 minutes
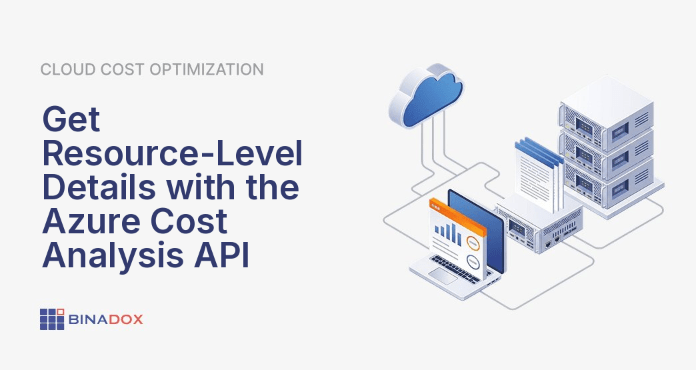
An intricate dashboard illustrating Azure cost analysis API resource details, showing how programmatic access can break down cloud spending to individual virtual machines, storage accounts, and databases for precise optimization and financial management.
Published July 10, 2026
Cloud Cost Optimization
~4 minutes
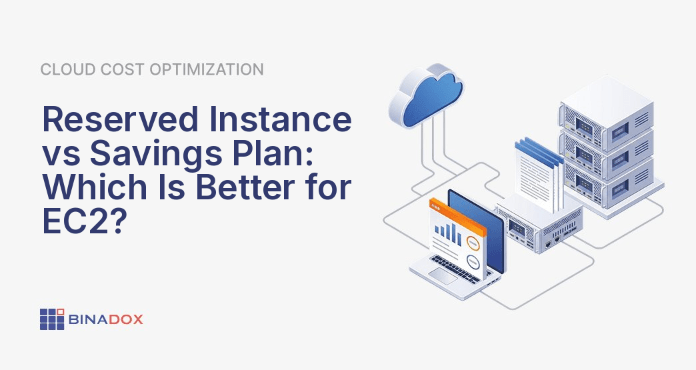
An illustration comparing reserved instance vs savings plan, showing Reserved Instances as a rigid, deeply rooted tree offering high, specific discounts, and Savings Plans as a flexible river covering broad usage with consistent savings. This visual metaphor highlights the trade-off between specificity for maximum savings and flexibility for adaptable cloud cost management.
Published July 10, 2026
Cloud Cost Optimization
~4 minutes
1…2122232425…222

Get started now

Minimize the cloud costs. Maximize the business value.
7-day free trial
Full platform access
Cancel anytime